Paiute vs Immigrants from Bolivia Female Poverty Among 18-24 Year Olds
COMPARE
Paiute
Immigrants from Bolivia
Female Poverty Among 18-24 Year Olds
Female Poverty Among 18-24 Year Olds Comparison
Paiute
Immigrants from Bolivia
23.3%
FEMALE POVERTY AMONG 18-24 YEAR OLDS
0.0/ 100
METRIC RATING
306th/ 347
METRIC RANK
16.7%
FEMALE POVERTY AMONG 18-24 YEAR OLDS
100.0/ 100
METRIC RATING
8th/ 347
METRIC RANK
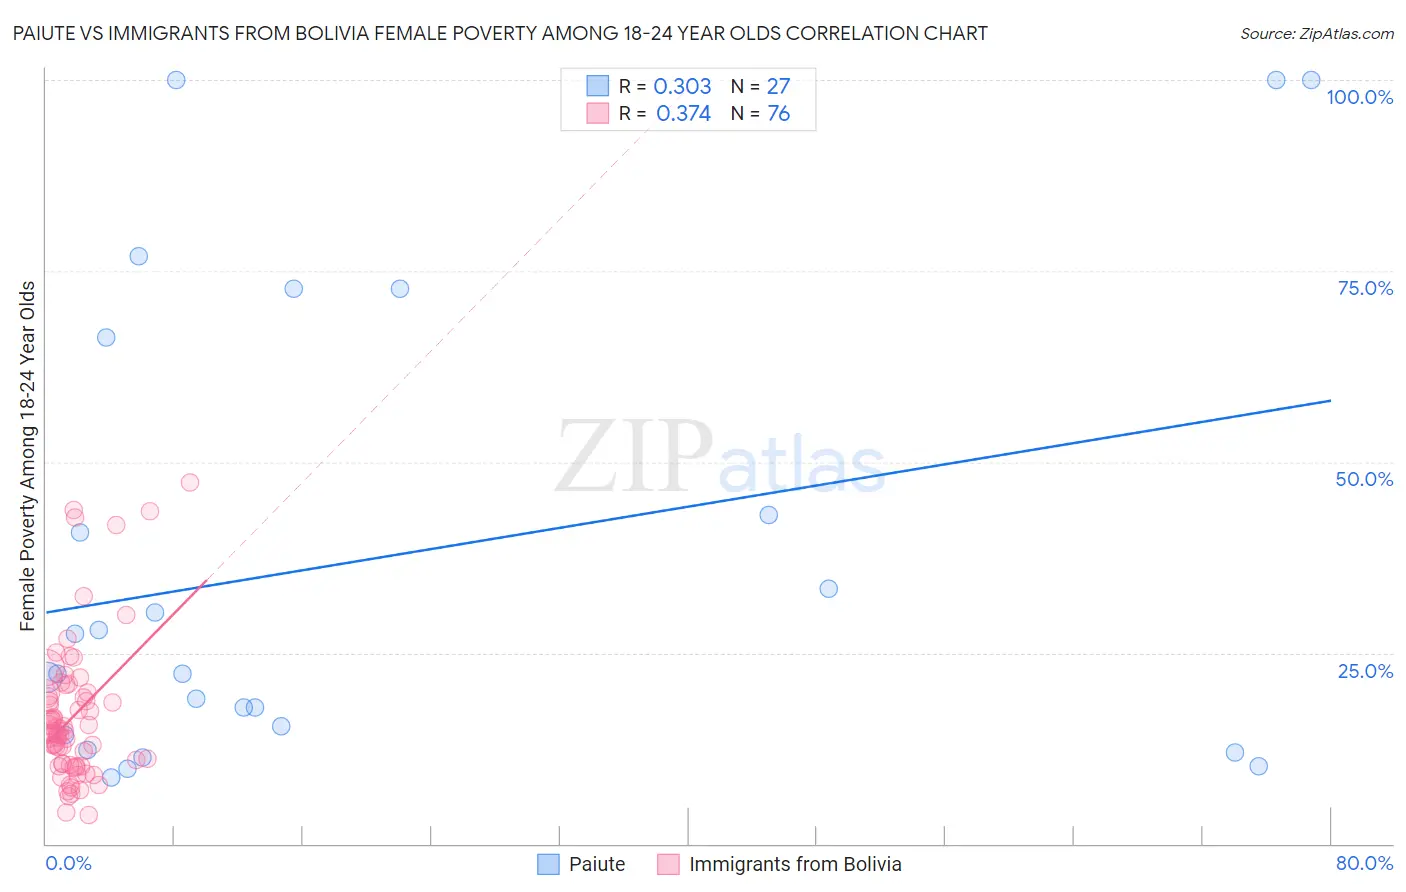
Paiute vs Immigrants from Bolivia Female Poverty Among 18-24 Year Olds Correlation Chart
The statistical analysis conducted on geographies consisting of 58,137,194 people shows a mild positive correlation between the proportion of Paiute and poverty level among females between the ages 18 and 24 in the United States with a correlation coefficient (R) of 0.303 and weighted average of 23.3%. Similarly, the statistical analysis conducted on geographies consisting of 157,283,381 people shows a mild positive correlation between the proportion of Immigrants from Bolivia and poverty level among females between the ages 18 and 24 in the United States with a correlation coefficient (R) of 0.374 and weighted average of 16.7%, a difference of 39.2%.
Female Poverty Among 18-24 Year Olds Correlation Summary
| Measurement | Paiute | Immigrants from Bolivia |
| Minimum | 8.7% | 3.7% |
| Maximum | 100.0% | 47.4% |
| Range | 91.3% | 43.7% |
| Mean | 37.3% | 16.7% |
| Median | 22.2% | 14.7% |
| Interquartile 25% (IQ1) | 14.3% | 10.4% |
| Interquartile 75% (IQ3) | 66.2% | 19.5% |
| Interquartile Range (IQR) | 51.9% | 9.1% |
| Standard Deviation (Sample) | 30.4% | 9.2% |
| Standard Deviation (Population) | 29.8% | 9.2% |
Similar Demographics by Female Poverty Among 18-24 Year Olds
Demographics Similar to Paiute by Female Poverty Among 18-24 Year Olds
In terms of female poverty among 18-24 year olds, the demographic groups most similar to Paiute are Cree (23.4%, a difference of 0.59%), Immigrants from Sudan (23.5%, a difference of 0.94%), Immigrants from Kuwait (23.0%, a difference of 1.1%), Sudanese (23.0%, a difference of 1.2%), and Senegalese (23.0%, a difference of 1.3%).
| Demographics | Rating | Rank | Female Poverty Among 18-24 Year Olds |
| Cherokee | 0.0 /100 | #299 | Tragic 22.7% |
| Africans | 0.0 /100 | #300 | Tragic 22.8% |
| Seminole | 0.0 /100 | #301 | Tragic 22.9% |
| Iroquois | 0.0 /100 | #302 | Tragic 22.9% |
| Senegalese | 0.0 /100 | #303 | Tragic 23.0% |
| Sudanese | 0.0 /100 | #304 | Tragic 23.0% |
| Immigrants | Kuwait | 0.0 /100 | #305 | Tragic 23.0% |
| Paiute | 0.0 /100 | #306 | Tragic 23.3% |
| Cree | 0.0 /100 | #307 | Tragic 23.4% |
| Immigrants | Sudan | 0.0 /100 | #308 | Tragic 23.5% |
| Blackfeet | 0.0 /100 | #309 | Tragic 23.6% |
| Comanche | 0.0 /100 | #310 | Tragic 23.6% |
| Potawatomi | 0.0 /100 | #311 | Tragic 23.7% |
| Yuman | 0.0 /100 | #312 | Tragic 24.0% |
| Creek | 0.0 /100 | #313 | Tragic 24.2% |
Demographics Similar to Immigrants from Bolivia by Female Poverty Among 18-24 Year Olds
In terms of female poverty among 18-24 year olds, the demographic groups most similar to Immigrants from Bolivia are Immigrants from the Azores (16.7%, a difference of 0.29%), Immigrants from Philippines (16.7%, a difference of 0.35%), Immigrants from Peru (16.9%, a difference of 0.84%), Immigrants from Portugal (16.5%, a difference of 1.1%), and Korean (16.9%, a difference of 1.2%).
| Demographics | Rating | Rank | Female Poverty Among 18-24 Year Olds |
| Assyrians/Chaldeans/Syriacs | 100.0 /100 | #1 | Exceptional 13.7% |
| Chinese | 100.0 /100 | #2 | Exceptional 16.2% |
| Immigrants | Cuba | 100.0 /100 | #3 | Exceptional 16.4% |
| Immigrants | India | 100.0 /100 | #4 | Exceptional 16.4% |
| Immigrants | Portugal | 100.0 /100 | #5 | Exceptional 16.5% |
| Immigrants | Philippines | 100.0 /100 | #6 | Exceptional 16.7% |
| Immigrants | Azores | 100.0 /100 | #7 | Exceptional 16.7% |
| Immigrants | Bolivia | 100.0 /100 | #8 | Exceptional 16.7% |
| Immigrants | Peru | 100.0 /100 | #9 | Exceptional 16.9% |
| Koreans | 100.0 /100 | #10 | Exceptional 16.9% |
| Thais | 100.0 /100 | #11 | Exceptional 17.0% |
| Immigrants | Pakistan | 100.0 /100 | #12 | Exceptional 17.0% |
| Immigrants | Poland | 100.0 /100 | #13 | Exceptional 17.1% |
| Tongans | 100.0 /100 | #14 | Exceptional 17.1% |
| Cubans | 100.0 /100 | #15 | Exceptional 17.2% |