Paiute vs Immigrants from Uganda Female Poverty Among 18-24 Year Olds
COMPARE
Paiute
Immigrants from Uganda
Female Poverty Among 18-24 Year Olds
Female Poverty Among 18-24 Year Olds Comparison
Paiute
Immigrants from Uganda
23.3%
FEMALE POVERTY AMONG 18-24 YEAR OLDS
0.0/ 100
METRIC RATING
306th/ 347
METRIC RANK
20.8%
FEMALE POVERTY AMONG 18-24 YEAR OLDS
5.1/ 100
METRIC RATING
235th/ 347
METRIC RANK
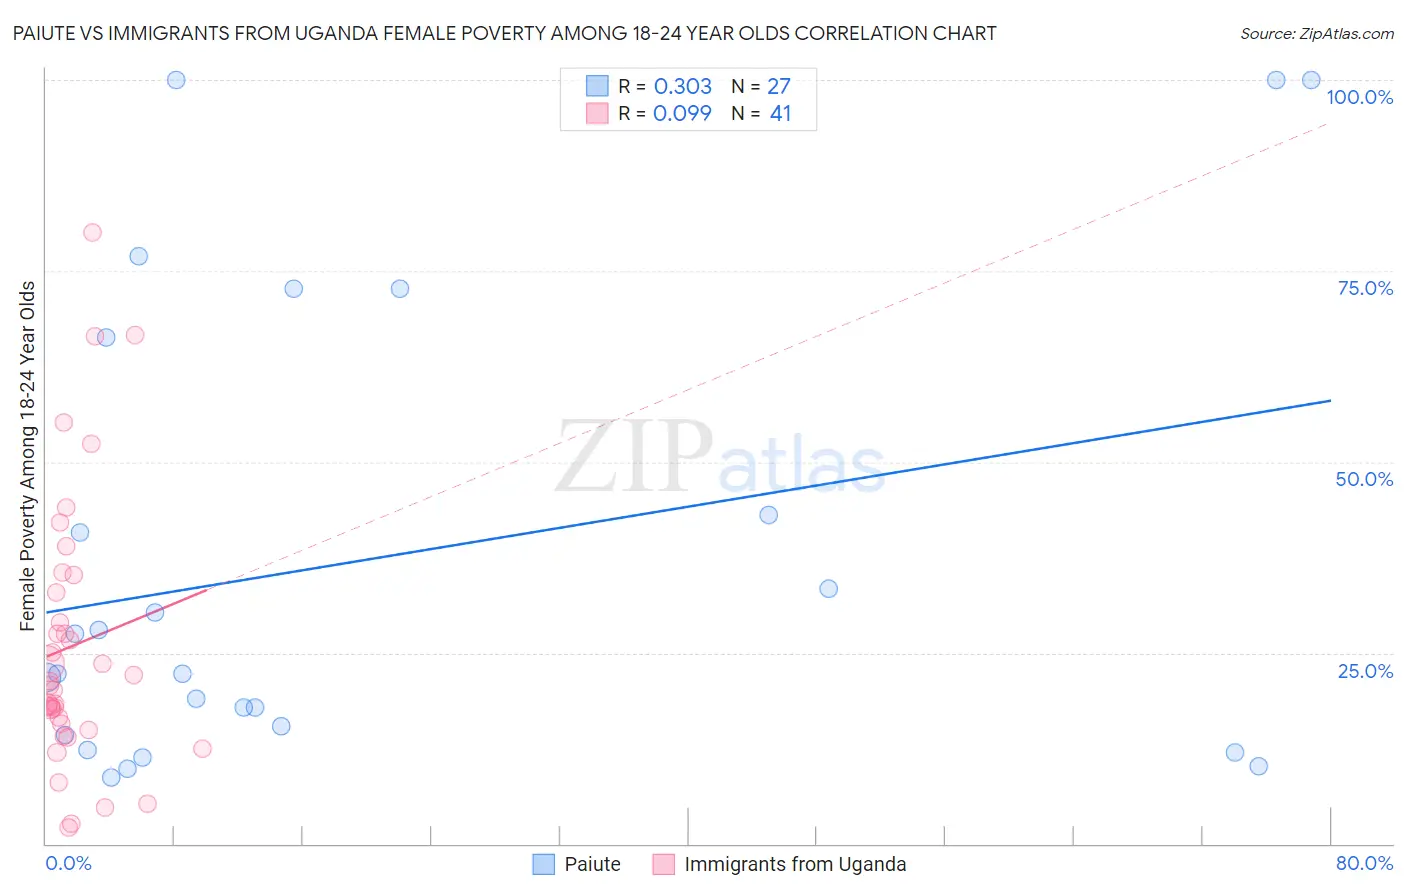
Paiute vs Immigrants from Uganda Female Poverty Among 18-24 Year Olds Correlation Chart
The statistical analysis conducted on geographies consisting of 58,137,194 people shows a mild positive correlation between the proportion of Paiute and poverty level among females between the ages 18 and 24 in the United States with a correlation coefficient (R) of 0.303 and weighted average of 23.3%. Similarly, the statistical analysis conducted on geographies consisting of 125,287,235 people shows a slight positive correlation between the proportion of Immigrants from Uganda and poverty level among females between the ages 18 and 24 in the United States with a correlation coefficient (R) of 0.099 and weighted average of 20.8%, a difference of 11.8%.
Female Poverty Among 18-24 Year Olds Correlation Summary
| Measurement | Paiute | Immigrants from Uganda |
| Minimum | 8.7% | 2.2% |
| Maximum | 100.0% | 80.0% |
| Range | 91.3% | 77.8% |
| Mean | 37.3% | 26.0% |
| Median | 22.2% | 20.7% |
| Interquartile 25% (IQ1) | 14.3% | 15.3% |
| Interquartile 75% (IQ3) | 66.2% | 34.0% |
| Interquartile Range (IQR) | 51.9% | 18.7% |
| Standard Deviation (Sample) | 30.4% | 17.7% |
| Standard Deviation (Population) | 29.8% | 17.5% |
Similar Demographics by Female Poverty Among 18-24 Year Olds
Demographics Similar to Paiute by Female Poverty Among 18-24 Year Olds
In terms of female poverty among 18-24 year olds, the demographic groups most similar to Paiute are Cree (23.4%, a difference of 0.59%), Immigrants from Sudan (23.5%, a difference of 0.94%), Immigrants from Kuwait (23.0%, a difference of 1.1%), Sudanese (23.0%, a difference of 1.2%), and Senegalese (23.0%, a difference of 1.3%).
| Demographics | Rating | Rank | Female Poverty Among 18-24 Year Olds |
| Cherokee | 0.0 /100 | #299 | Tragic 22.7% |
| Africans | 0.0 /100 | #300 | Tragic 22.8% |
| Seminole | 0.0 /100 | #301 | Tragic 22.9% |
| Iroquois | 0.0 /100 | #302 | Tragic 22.9% |
| Senegalese | 0.0 /100 | #303 | Tragic 23.0% |
| Sudanese | 0.0 /100 | #304 | Tragic 23.0% |
| Immigrants | Kuwait | 0.0 /100 | #305 | Tragic 23.0% |
| Paiute | 0.0 /100 | #306 | Tragic 23.3% |
| Cree | 0.0 /100 | #307 | Tragic 23.4% |
| Immigrants | Sudan | 0.0 /100 | #308 | Tragic 23.5% |
| Blackfeet | 0.0 /100 | #309 | Tragic 23.6% |
| Comanche | 0.0 /100 | #310 | Tragic 23.6% |
| Potawatomi | 0.0 /100 | #311 | Tragic 23.7% |
| Yuman | 0.0 /100 | #312 | Tragic 24.0% |
| Creek | 0.0 /100 | #313 | Tragic 24.2% |
Demographics Similar to Immigrants from Uganda by Female Poverty Among 18-24 Year Olds
In terms of female poverty among 18-24 year olds, the demographic groups most similar to Immigrants from Uganda are Okinawan (20.8%, a difference of 0.040%), Welsh (20.8%, a difference of 0.080%), Scottish (20.9%, a difference of 0.15%), Immigrants from Denmark (20.8%, a difference of 0.18%), and Immigrants from Singapore (20.9%, a difference of 0.18%).
| Demographics | Rating | Rank | Female Poverty Among 18-24 Year Olds |
| Ghanaians | 6.5 /100 | #228 | Tragic 20.8% |
| Australians | 6.1 /100 | #229 | Tragic 20.8% |
| Whites/Caucasians | 6.1 /100 | #230 | Tragic 20.8% |
| Immigrants | St. Vincent and the Grenadines | 6.0 /100 | #231 | Tragic 20.8% |
| Finns | 6.0 /100 | #232 | Tragic 20.8% |
| Immigrants | Denmark | 5.8 /100 | #233 | Tragic 20.8% |
| Welsh | 5.4 /100 | #234 | Tragic 20.8% |
| Immigrants | Uganda | 5.1 /100 | #235 | Tragic 20.8% |
| Okinawans | 4.9 /100 | #236 | Tragic 20.8% |
| Scottish | 4.5 /100 | #237 | Tragic 20.9% |
| Immigrants | Singapore | 4.4 /100 | #238 | Tragic 20.9% |
| Immigrants | Guatemala | 4.3 /100 | #239 | Tragic 20.9% |
| Luxembourgers | 4.2 /100 | #240 | Tragic 20.9% |
| Immigrants | Eritrea | 4.2 /100 | #241 | Tragic 20.9% |
| Israelis | 4.1 /100 | #242 | Tragic 20.9% |