Paiute vs Nonimmigrants Female Poverty Among 18-24 Year Olds
COMPARE
Paiute
Nonimmigrants
Female Poverty Among 18-24 Year Olds
Female Poverty Among 18-24 Year Olds Comparison
Paiute
Nonimmigrants
23.3%
FEMALE POVERTY AMONG 18-24 YEAR OLDS
0.0/ 100
METRIC RATING
306th/ 347
METRIC RANK
21.5%
FEMALE POVERTY AMONG 18-24 YEAR OLDS
0.3/ 100
METRIC RATING
265th/ 347
METRIC RANK
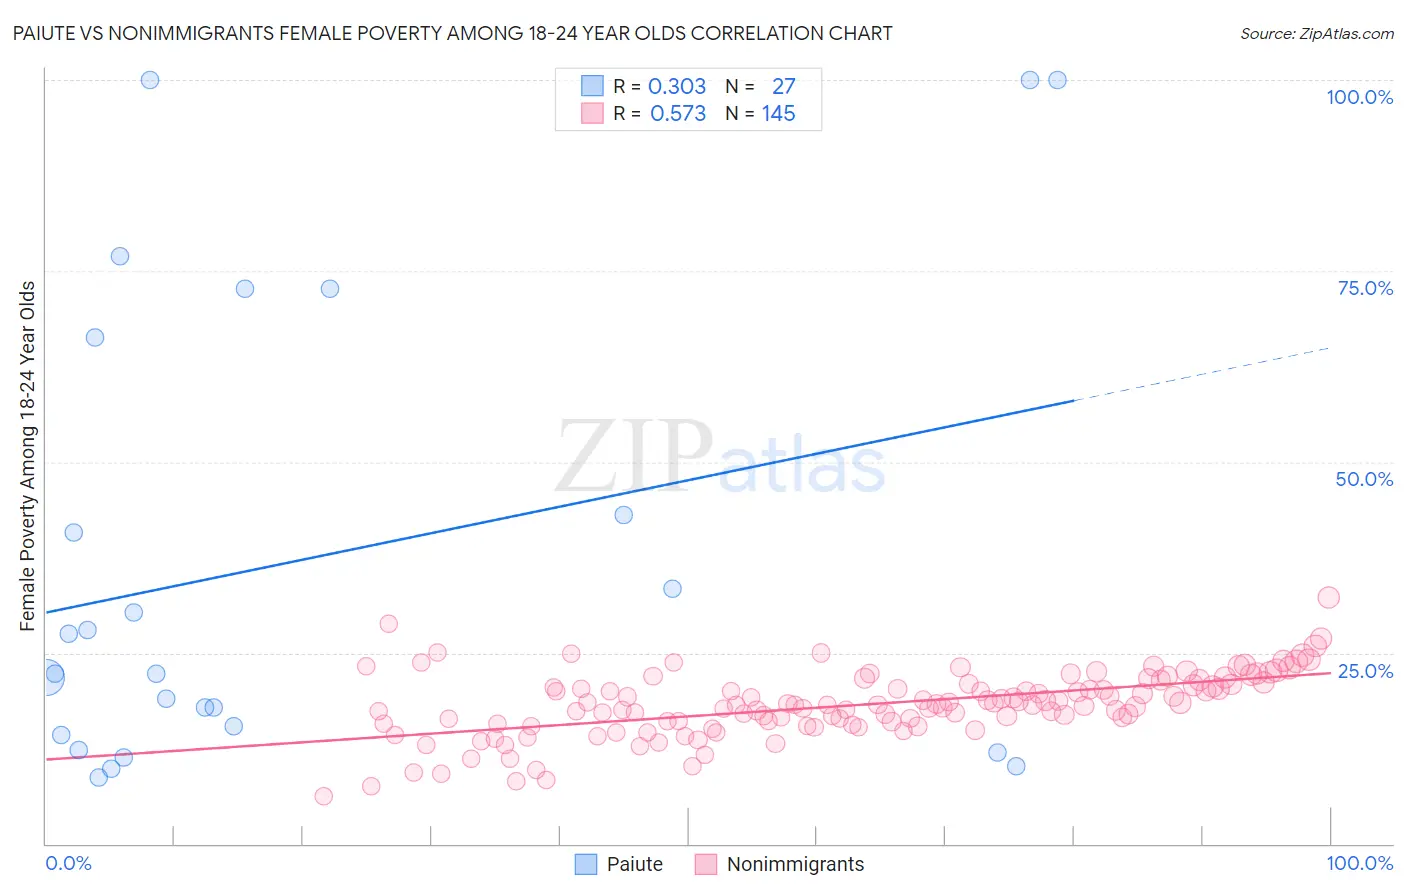
Paiute vs Nonimmigrants Female Poverty Among 18-24 Year Olds Correlation Chart
The statistical analysis conducted on geographies consisting of 58,137,194 people shows a mild positive correlation between the proportion of Paiute and poverty level among females between the ages 18 and 24 in the United States with a correlation coefficient (R) of 0.303 and weighted average of 23.3%. Similarly, the statistical analysis conducted on geographies consisting of 546,044,220 people shows a substantial positive correlation between the proportion of Nonimmigrants and poverty level among females between the ages 18 and 24 in the United States with a correlation coefficient (R) of 0.573 and weighted average of 21.5%, a difference of 8.2%.
Female Poverty Among 18-24 Year Olds Correlation Summary
| Measurement | Paiute | Nonimmigrants |
| Minimum | 8.7% | 6.2% |
| Maximum | 100.0% | 32.3% |
| Range | 91.3% | 26.1% |
| Mean | 37.3% | 18.2% |
| Median | 22.2% | 18.2% |
| Interquartile 25% (IQ1) | 14.3% | 15.7% |
| Interquartile 75% (IQ3) | 66.2% | 20.9% |
| Interquartile Range (IQR) | 51.9% | 5.2% |
| Standard Deviation (Sample) | 30.4% | 4.3% |
| Standard Deviation (Population) | 29.8% | 4.2% |
Similar Demographics by Female Poverty Among 18-24 Year Olds
Demographics Similar to Paiute by Female Poverty Among 18-24 Year Olds
In terms of female poverty among 18-24 year olds, the demographic groups most similar to Paiute are Cree (23.4%, a difference of 0.59%), Immigrants from Sudan (23.5%, a difference of 0.94%), Immigrants from Kuwait (23.0%, a difference of 1.1%), Sudanese (23.0%, a difference of 1.2%), and Senegalese (23.0%, a difference of 1.3%).
| Demographics | Rating | Rank | Female Poverty Among 18-24 Year Olds |
| Cherokee | 0.0 /100 | #299 | Tragic 22.7% |
| Africans | 0.0 /100 | #300 | Tragic 22.8% |
| Seminole | 0.0 /100 | #301 | Tragic 22.9% |
| Iroquois | 0.0 /100 | #302 | Tragic 22.9% |
| Senegalese | 0.0 /100 | #303 | Tragic 23.0% |
| Sudanese | 0.0 /100 | #304 | Tragic 23.0% |
| Immigrants | Kuwait | 0.0 /100 | #305 | Tragic 23.0% |
| Paiute | 0.0 /100 | #306 | Tragic 23.3% |
| Cree | 0.0 /100 | #307 | Tragic 23.4% |
| Immigrants | Sudan | 0.0 /100 | #308 | Tragic 23.5% |
| Blackfeet | 0.0 /100 | #309 | Tragic 23.6% |
| Comanche | 0.0 /100 | #310 | Tragic 23.6% |
| Potawatomi | 0.0 /100 | #311 | Tragic 23.7% |
| Yuman | 0.0 /100 | #312 | Tragic 24.0% |
| Creek | 0.0 /100 | #313 | Tragic 24.2% |
Demographics Similar to Nonimmigrants by Female Poverty Among 18-24 Year Olds
In terms of female poverty among 18-24 year olds, the demographic groups most similar to Nonimmigrants are Honduran (21.5%, a difference of 0.010%), Icelander (21.5%, a difference of 0.060%), Alaska Native (21.5%, a difference of 0.070%), American (21.6%, a difference of 0.15%), and Immigrants from Burma/Myanmar (21.6%, a difference of 0.30%).
| Demographics | Rating | Rank | Female Poverty Among 18-24 Year Olds |
| Vietnamese | 0.6 /100 | #258 | Tragic 21.4% |
| Immigrants | France | 0.6 /100 | #259 | Tragic 21.4% |
| Immigrants | Norway | 0.6 /100 | #260 | Tragic 21.4% |
| Immigrants | Bahamas | 0.5 /100 | #261 | Tragic 21.4% |
| Immigrants | Eastern Africa | 0.4 /100 | #262 | Tragic 21.4% |
| Icelanders | 0.3 /100 | #263 | Tragic 21.5% |
| Hondurans | 0.3 /100 | #264 | Tragic 21.5% |
| Immigrants | Nonimmigrants | 0.3 /100 | #265 | Tragic 21.5% |
| Alaska Natives | 0.3 /100 | #266 | Tragic 21.5% |
| Americans | 0.3 /100 | #267 | Tragic 21.6% |
| Immigrants | Burma/Myanmar | 0.2 /100 | #268 | Tragic 21.6% |
| Celtics | 0.2 /100 | #269 | Tragic 21.6% |
| Mongolians | 0.2 /100 | #270 | Tragic 21.6% |
| Scotch-Irish | 0.2 /100 | #271 | Tragic 21.6% |
| Basques | 0.2 /100 | #272 | Tragic 21.7% |