Immigrants from Jamaica vs Immigrants from Egypt Single Mother Poverty
COMPARE
Immigrants from Jamaica
Immigrants from Egypt
Single Mother Poverty
Single Mother Poverty Comparison
Immigrants from Jamaica
Immigrants from Egypt
29.6%
SINGLE MOTHER POVERTY
22.0/ 100
METRIC RATING
197th/ 347
METRIC RANK
27.1%
SINGLE MOTHER POVERTY
99.7/ 100
METRIC RATING
55th/ 347
METRIC RANK
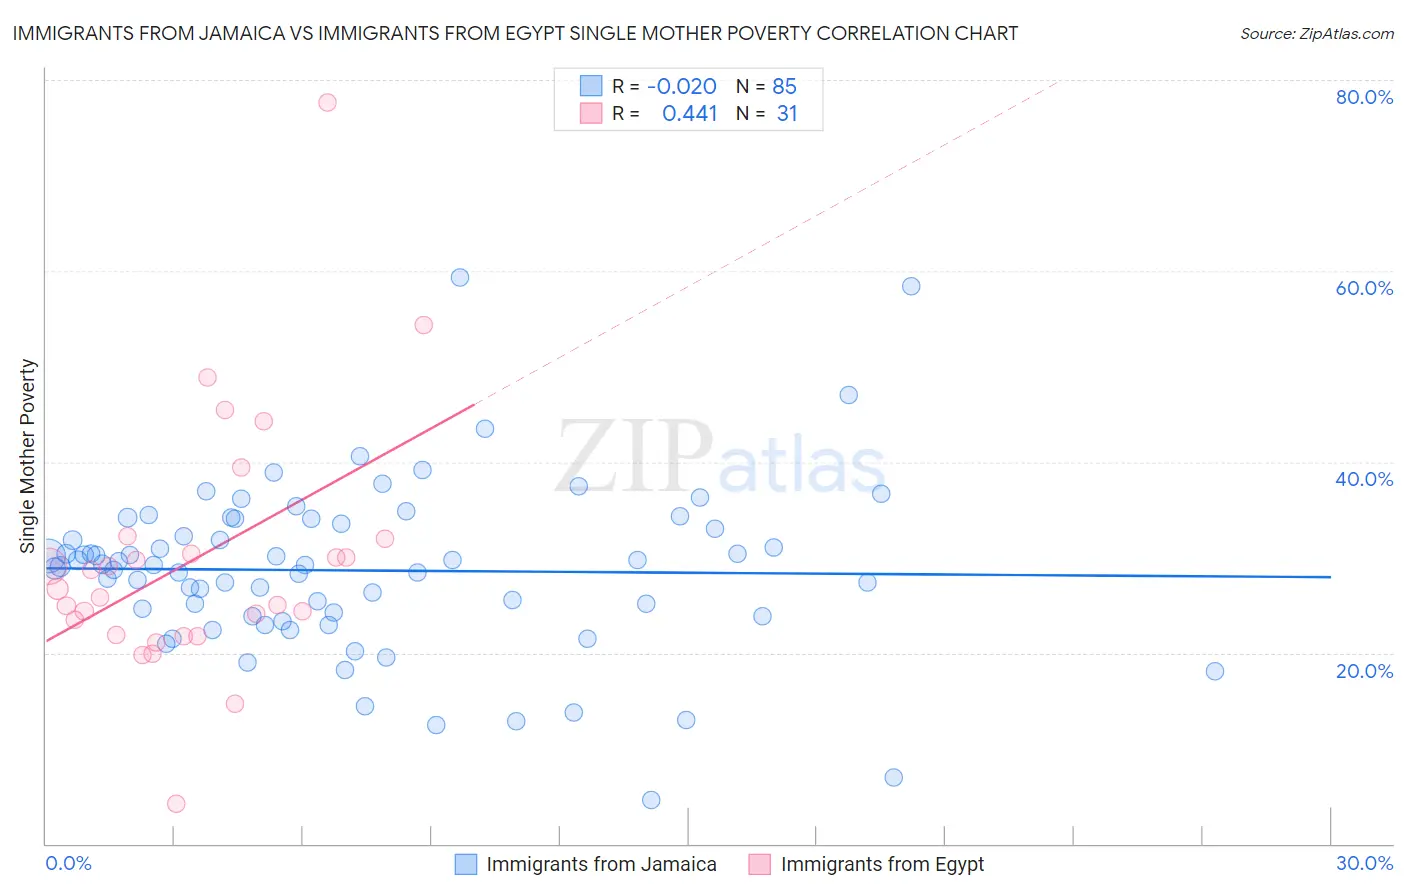
Immigrants from Jamaica vs Immigrants from Egypt Single Mother Poverty Correlation Chart
The statistical analysis conducted on geographies consisting of 296,527,600 people shows no correlation between the proportion of Immigrants from Jamaica and poverty level among single mothers in the United States with a correlation coefficient (R) of -0.020 and weighted average of 29.6%. Similarly, the statistical analysis conducted on geographies consisting of 241,181,927 people shows a moderate positive correlation between the proportion of Immigrants from Egypt and poverty level among single mothers in the United States with a correlation coefficient (R) of 0.441 and weighted average of 27.1%, a difference of 9.1%.
Single Mother Poverty Correlation Summary
| Measurement | Immigrants from Jamaica | Immigrants from Egypt |
| Minimum | 4.6% | 4.2% |
| Maximum | 59.3% | 77.6% |
| Range | 54.7% | 73.4% |
| Mean | 28.6% | 29.8% |
| Median | 29.2% | 26.7% |
| Interquartile 25% (IQ1) | 23.9% | 21.9% |
| Interquartile 75% (IQ3) | 33.8% | 31.9% |
| Interquartile Range (IQR) | 9.9% | 10.1% |
| Standard Deviation (Sample) | 8.9% | 13.4% |
| Standard Deviation (Population) | 8.9% | 13.2% |
Similar Demographics by Single Mother Poverty
Demographics Similar to Immigrants from Jamaica by Single Mother Poverty
In terms of single mother poverty, the demographic groups most similar to Immigrants from Jamaica are Trinidadian and Tobagonian (29.6%, a difference of 0.020%), Cuban (29.6%, a difference of 0.080%), Spanish American Indian (29.6%, a difference of 0.10%), Panamanian (29.6%, a difference of 0.14%), and Slavic (29.6%, a difference of 0.17%).
| Demographics | Rating | Rank | Single Mother Poverty |
| Immigrants | Germany | 30.4 /100 | #190 | Fair 29.5% |
| Immigrants | Trinidad and Tobago | 29.2 /100 | #191 | Fair 29.5% |
| Moroccans | 28.6 /100 | #192 | Fair 29.5% |
| Basques | 28.3 /100 | #193 | Fair 29.5% |
| Icelanders | 26.1 /100 | #194 | Fair 29.5% |
| Slavs | 24.5 /100 | #195 | Fair 29.6% |
| Spanish American Indians | 23.4 /100 | #196 | Fair 29.6% |
| Immigrants | Jamaica | 22.0 /100 | #197 | Fair 29.6% |
| Trinidadians and Tobagonians | 21.7 /100 | #198 | Fair 29.6% |
| Cubans | 20.8 /100 | #199 | Fair 29.6% |
| Panamanians | 20.0 /100 | #200 | Fair 29.6% |
| Belgians | 18.8 /100 | #201 | Poor 29.7% |
| Malaysians | 17.4 /100 | #202 | Poor 29.7% |
| Swiss | 17.2 /100 | #203 | Poor 29.7% |
| Immigrants | Immigrants | 16.6 /100 | #204 | Poor 29.7% |
Demographics Similar to Immigrants from Egypt by Single Mother Poverty
In terms of single mother poverty, the demographic groups most similar to Immigrants from Egypt are Immigrants from Bulgaria (27.1%, a difference of 0.030%), Immigrants from Romania (27.2%, a difference of 0.050%), Immigrants from Jordan (27.1%, a difference of 0.060%), Palestinian (27.2%, a difference of 0.080%), and Immigrants from South Eastern Asia (27.1%, a difference of 0.10%).
| Demographics | Rating | Rank | Single Mother Poverty |
| Immigrants | Poland | 99.8 /100 | #48 | Exceptional 26.9% |
| Cambodians | 99.8 /100 | #49 | Exceptional 27.0% |
| Laotians | 99.8 /100 | #50 | Exceptional 27.0% |
| Immigrants | Argentina | 99.7 /100 | #51 | Exceptional 27.1% |
| Immigrants | South Eastern Asia | 99.7 /100 | #52 | Exceptional 27.1% |
| Immigrants | Jordan | 99.7 /100 | #53 | Exceptional 27.1% |
| Immigrants | Bulgaria | 99.7 /100 | #54 | Exceptional 27.1% |
| Immigrants | Egypt | 99.7 /100 | #55 | Exceptional 27.1% |
| Immigrants | Romania | 99.7 /100 | #56 | Exceptional 27.2% |
| Palestinians | 99.7 /100 | #57 | Exceptional 27.2% |
| Argentineans | 99.6 /100 | #58 | Exceptional 27.2% |
| Paraguayans | 99.6 /100 | #59 | Exceptional 27.2% |
| Eastern Europeans | 99.6 /100 | #60 | Exceptional 27.2% |
| Immigrants | Eastern Europe | 99.6 /100 | #61 | Exceptional 27.2% |
| Immigrants | Malaysia | 99.5 /100 | #62 | Exceptional 27.3% |