Immigrants from Egypt vs Polish Receiving Food Stamps
COMPARE
Immigrants from Egypt
Polish
Receiving Food Stamps
Receiving Food Stamps Comparison
Immigrants from Egypt
Poles
10.3%
RECEIVING FOOD STAMPS
97.1/ 100
METRIC RATING
98th/ 347
METRIC RANK
10.0%
RECEIVING FOOD STAMPS
98.6/ 100
METRIC RATING
80th/ 347
METRIC RANK
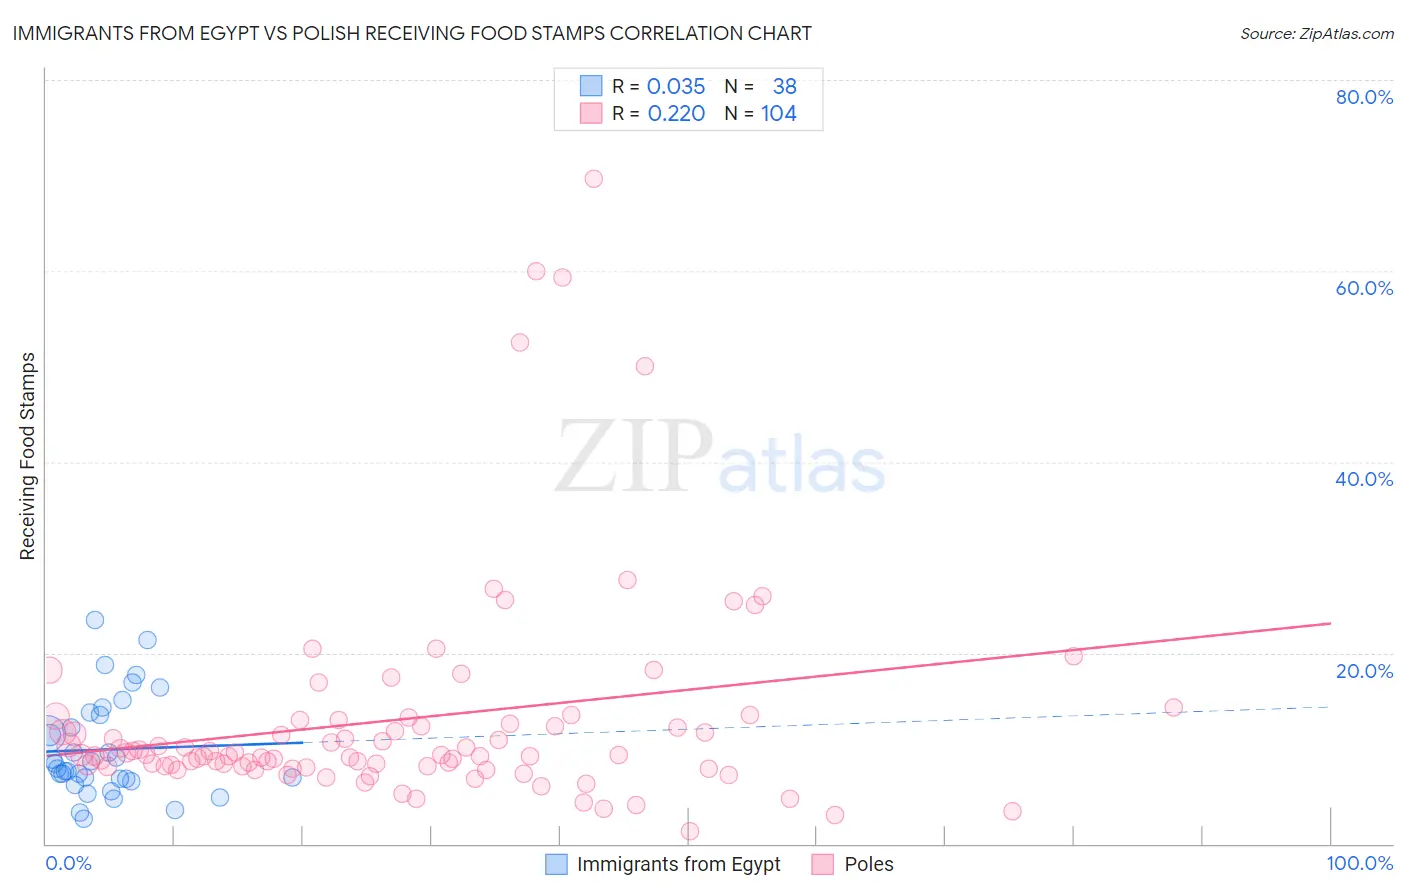
Immigrants from Egypt vs Polish Receiving Food Stamps Correlation Chart
The statistical analysis conducted on geographies consisting of 245,027,906 people shows no correlation between the proportion of Immigrants from Egypt and percentage of population receiving government assistance and/or food stamps in the United States with a correlation coefficient (R) of 0.035 and weighted average of 10.3%. Similarly, the statistical analysis conducted on geographies consisting of 556,985,146 people shows a weak positive correlation between the proportion of Poles and percentage of population receiving government assistance and/or food stamps in the United States with a correlation coefficient (R) of 0.220 and weighted average of 10.0%, a difference of 3.2%.
Receiving Food Stamps Correlation Summary
| Measurement | Immigrants from Egypt | Polish |
| Minimum | 2.6% | 1.3% |
| Maximum | 23.5% | 69.7% |
| Range | 20.9% | 68.4% |
| Mean | 9.9% | 13.0% |
| Median | 8.2% | 9.3% |
| Interquartile 25% (IQ1) | 6.8% | 8.1% |
| Interquartile 75% (IQ3) | 13.5% | 12.7% |
| Interquartile Range (IQR) | 6.7% | 4.6% |
| Standard Deviation (Sample) | 5.1% | 11.6% |
| Standard Deviation (Population) | 5.0% | 11.5% |
Demographics Similar to Immigrants from Egypt and Poles by Receiving Food Stamps
In terms of receiving food stamps, the demographic groups most similar to Immigrants from Egypt are Czechoslovakian (10.3%, a difference of 0.060%), Serbian (10.3%, a difference of 0.17%), Welsh (10.3%, a difference of 0.31%), Basque (10.3%, a difference of 0.37%), and Immigrants from Greece (10.3%, a difference of 0.39%). Similarly, the demographic groups most similar to Poles are Laotian (10.0%, a difference of 0.080%), Immigrants from England (10.0%, a difference of 0.14%), Austrian (10.0%, a difference of 0.27%), Dutch (10.0%, a difference of 0.27%), and Immigrants from Israel (10.0%, a difference of 0.34%).
| Demographics | Rating | Rank | Receiving Food Stamps |
| Laotians | 98.7 /100 | #79 | Exceptional 10.0% |
| Poles | 98.6 /100 | #80 | Exceptional 10.0% |
| Immigrants | England | 98.6 /100 | #81 | Exceptional 10.0% |
| Austrians | 98.6 /100 | #82 | Exceptional 10.0% |
| Dutch | 98.6 /100 | #83 | Exceptional 10.0% |
| Immigrants | Israel | 98.5 /100 | #84 | Exceptional 10.0% |
| Immigrants | Romania | 98.5 /100 | #85 | Exceptional 10.0% |
| Immigrants | Norway | 98.4 /100 | #86 | Exceptional 10.0% |
| Egyptians | 98.4 /100 | #87 | Exceptional 10.0% |
| Immigrants | Kuwait | 98.4 /100 | #88 | Exceptional 10.0% |
| Immigrants | France | 98.3 /100 | #89 | Exceptional 10.1% |
| Finns | 97.9 /100 | #90 | Exceptional 10.2% |
| Jordanians | 97.9 /100 | #91 | Exceptional 10.2% |
| Irish | 97.9 /100 | #92 | Exceptional 10.2% |
| Belgians | 97.7 /100 | #93 | Exceptional 10.2% |
| Immigrants | Greece | 97.4 /100 | #94 | Exceptional 10.3% |
| Basques | 97.4 /100 | #95 | Exceptional 10.3% |
| Welsh | 97.3 /100 | #96 | Exceptional 10.3% |
| Czechoslovakians | 97.2 /100 | #97 | Exceptional 10.3% |
| Immigrants | Egypt | 97.1 /100 | #98 | Exceptional 10.3% |
| Serbians | 97.0 /100 | #99 | Exceptional 10.3% |