Norwegian vs Slovene Single Father Poverty
COMPARE
Norwegian
Slovene
Single Father Poverty
Single Father Poverty Comparison
Norwegians
Slovenes
15.9%
SINGLE FATHER POVERTY
90.2/ 100
METRIC RATING
130th/ 347
METRIC RANK
17.3%
SINGLE FATHER POVERTY
0.3/ 100
METRIC RATING
264th/ 347
METRIC RANK
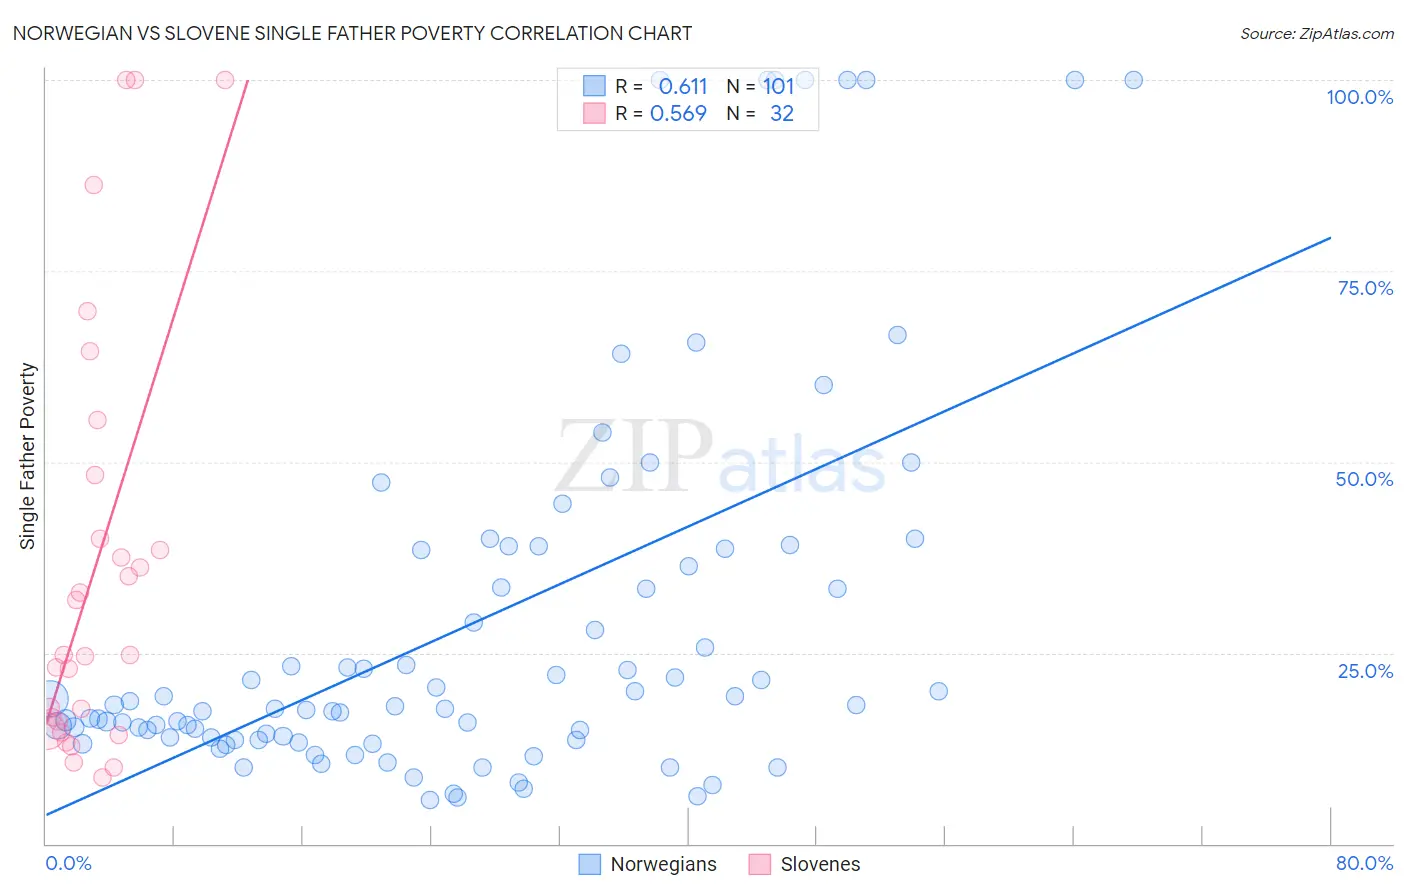
Norwegian vs Slovene Single Father Poverty Correlation Chart
The statistical analysis conducted on geographies consisting of 388,337,291 people shows a significant positive correlation between the proportion of Norwegians and poverty level among single fathers in the United States with a correlation coefficient (R) of 0.611 and weighted average of 15.9%. Similarly, the statistical analysis conducted on geographies consisting of 209,649,531 people shows a substantial positive correlation between the proportion of Slovenes and poverty level among single fathers in the United States with a correlation coefficient (R) of 0.569 and weighted average of 17.3%, a difference of 8.9%.
Single Father Poverty Correlation Summary
| Measurement | Norwegian | Slovene |
| Minimum | 5.8% | 8.6% |
| Maximum | 100.0% | 100.0% |
| Range | 94.2% | 91.4% |
| Mean | 28.6% | 36.3% |
| Median | 17.9% | 24.8% |
| Interquartile 25% (IQ1) | 13.8% | 15.4% |
| Interquartile 75% (IQ3) | 37.4% | 44.1% |
| Interquartile Range (IQR) | 23.6% | 28.7% |
| Standard Deviation (Sample) | 25.1% | 27.8% |
| Standard Deviation (Population) | 25.0% | 27.4% |
Similar Demographics by Single Father Poverty
Demographics Similar to Norwegians by Single Father Poverty
In terms of single father poverty, the demographic groups most similar to Norwegians are Nicaraguan (15.9%, a difference of 0.0%), Immigrants from Portugal (15.9%, a difference of 0.060%), Immigrants from Nigeria (15.9%, a difference of 0.080%), Immigrants from West Indies (15.9%, a difference of 0.080%), and Immigrants from Syria (15.9%, a difference of 0.080%).
| Demographics | Rating | Rank | Single Father Poverty |
| Palestinians | 91.3 /100 | #123 | Exceptional 15.9% |
| Immigrants | Panama | 91.3 /100 | #124 | Exceptional 15.9% |
| Iraqis | 91.2 /100 | #125 | Exceptional 15.9% |
| Hmong | 91.1 /100 | #126 | Exceptional 15.9% |
| Immigrants | Liberia | 91.1 /100 | #127 | Exceptional 15.9% |
| Immigrants | Nigeria | 90.8 /100 | #128 | Exceptional 15.9% |
| Immigrants | West Indies | 90.8 /100 | #129 | Exceptional 15.9% |
| Norwegians | 90.2 /100 | #130 | Exceptional 15.9% |
| Nicaraguans | 90.1 /100 | #131 | Exceptional 15.9% |
| Immigrants | Portugal | 89.7 /100 | #132 | Excellent 15.9% |
| Immigrants | Syria | 89.5 /100 | #133 | Excellent 15.9% |
| Immigrants | South America | 88.5 /100 | #134 | Excellent 15.9% |
| Immigrants | Sri Lanka | 88.2 /100 | #135 | Excellent 15.9% |
| Cypriots | 87.5 /100 | #136 | Excellent 15.9% |
| Immigrants | Azores | 87.2 /100 | #137 | Excellent 15.9% |
Demographics Similar to Slovenes by Single Father Poverty
In terms of single father poverty, the demographic groups most similar to Slovenes are Polish (17.3%, a difference of 0.0%), Jamaican (17.3%, a difference of 0.060%), Haitian (17.3%, a difference of 0.10%), Lithuanian (17.3%, a difference of 0.20%), and Immigrants from Caribbean (17.4%, a difference of 0.20%).
| Demographics | Rating | Rank | Single Father Poverty |
| Immigrants | Albania | 0.7 /100 | #257 | Tragic 17.2% |
| Albanians | 0.7 /100 | #258 | Tragic 17.2% |
| Immigrants | Jamaica | 0.7 /100 | #259 | Tragic 17.2% |
| Spaniards | 0.6 /100 | #260 | Tragic 17.2% |
| Swiss | 0.5 /100 | #261 | Tragic 17.3% |
| Immigrants | Zaire | 0.4 /100 | #262 | Tragic 17.3% |
| Lithuanians | 0.4 /100 | #263 | Tragic 17.3% |
| Slovenes | 0.3 /100 | #264 | Tragic 17.3% |
| Poles | 0.3 /100 | #265 | Tragic 17.3% |
| Jamaicans | 0.3 /100 | #266 | Tragic 17.3% |
| Haitians | 0.3 /100 | #267 | Tragic 17.3% |
| Immigrants | Caribbean | 0.3 /100 | #268 | Tragic 17.4% |
| Slavs | 0.3 /100 | #269 | Tragic 17.4% |
| Indonesians | 0.2 /100 | #270 | Tragic 17.4% |
| French American Indians | 0.2 /100 | #271 | Tragic 17.4% |