Norwegian vs Immigrants from South Eastern Asia Single Father Poverty
COMPARE
Norwegian
Immigrants from South Eastern Asia
Single Father Poverty
Single Father Poverty Comparison
Norwegians
Immigrants from South Eastern Asia
15.9%
SINGLE FATHER POVERTY
90.2/ 100
METRIC RATING
130th/ 347
METRIC RANK
14.4%
SINGLE FATHER POVERTY
100.0/ 100
METRIC RATING
24th/ 347
METRIC RANK
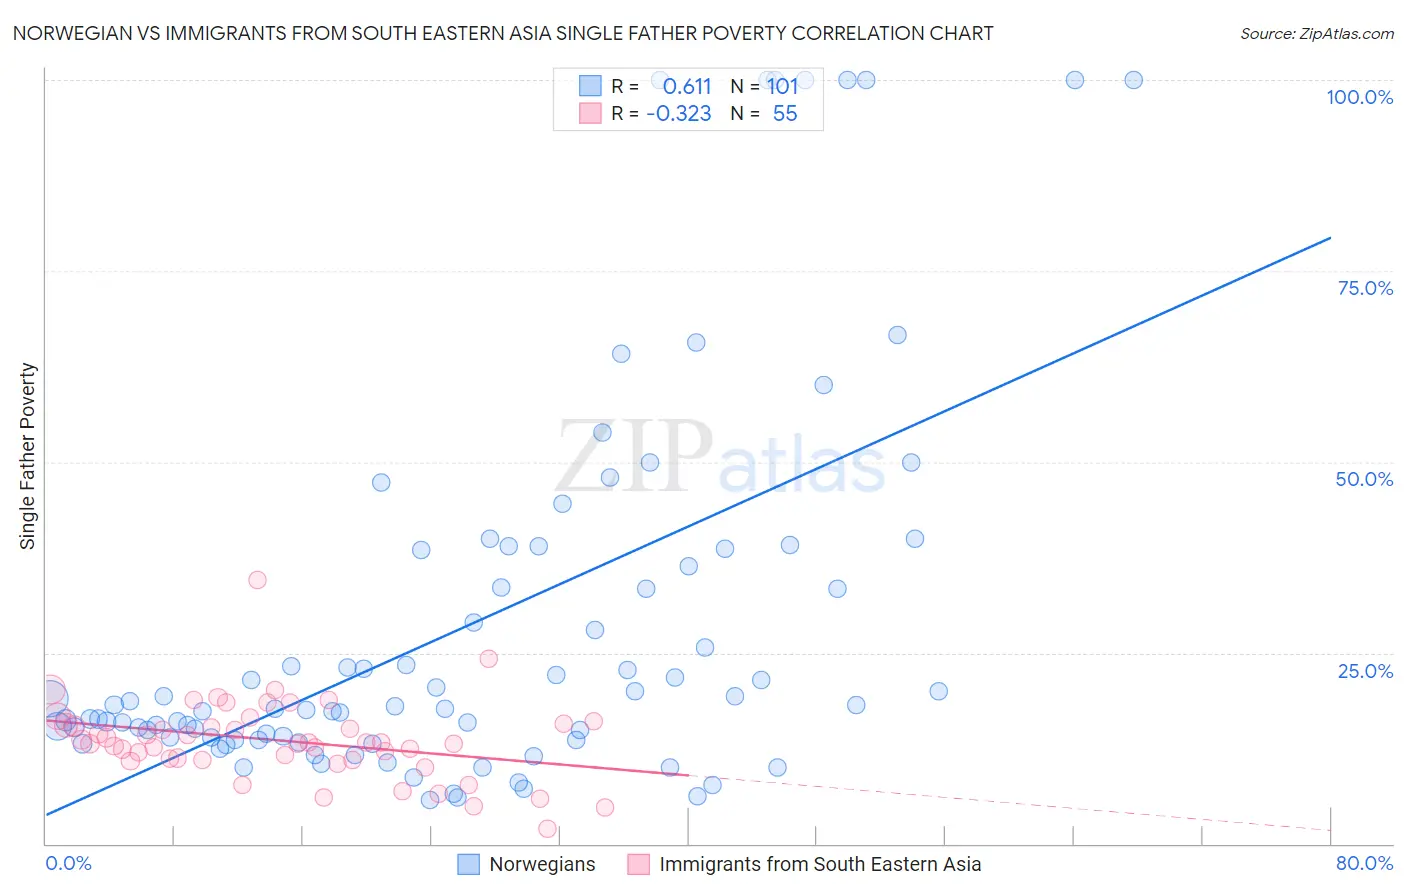
Norwegian vs Immigrants from South Eastern Asia Single Father Poverty Correlation Chart
The statistical analysis conducted on geographies consisting of 388,337,291 people shows a significant positive correlation between the proportion of Norwegians and poverty level among single fathers in the United States with a correlation coefficient (R) of 0.611 and weighted average of 15.9%. Similarly, the statistical analysis conducted on geographies consisting of 383,820,731 people shows a mild negative correlation between the proportion of Immigrants from South Eastern Asia and poverty level among single fathers in the United States with a correlation coefficient (R) of -0.323 and weighted average of 14.4%, a difference of 10.7%.
Single Father Poverty Correlation Summary
| Measurement | Norwegian | Immigrants from South Eastern Asia |
| Minimum | 5.8% | 2.0% |
| Maximum | 100.0% | 34.5% |
| Range | 94.2% | 32.5% |
| Mean | 28.6% | 13.5% |
| Median | 17.9% | 13.2% |
| Interquartile 25% (IQ1) | 13.8% | 11.0% |
| Interquartile 75% (IQ3) | 37.4% | 15.8% |
| Interquartile Range (IQR) | 23.6% | 4.8% |
| Standard Deviation (Sample) | 25.1% | 5.2% |
| Standard Deviation (Population) | 25.0% | 5.2% |
Similar Demographics by Single Father Poverty
Demographics Similar to Norwegians by Single Father Poverty
In terms of single father poverty, the demographic groups most similar to Norwegians are Nicaraguan (15.9%, a difference of 0.0%), Immigrants from Portugal (15.9%, a difference of 0.060%), Immigrants from Nigeria (15.9%, a difference of 0.080%), Immigrants from West Indies (15.9%, a difference of 0.080%), and Immigrants from Syria (15.9%, a difference of 0.080%).
| Demographics | Rating | Rank | Single Father Poverty |
| Palestinians | 91.3 /100 | #123 | Exceptional 15.9% |
| Immigrants | Panama | 91.3 /100 | #124 | Exceptional 15.9% |
| Iraqis | 91.2 /100 | #125 | Exceptional 15.9% |
| Hmong | 91.1 /100 | #126 | Exceptional 15.9% |
| Immigrants | Liberia | 91.1 /100 | #127 | Exceptional 15.9% |
| Immigrants | Nigeria | 90.8 /100 | #128 | Exceptional 15.9% |
| Immigrants | West Indies | 90.8 /100 | #129 | Exceptional 15.9% |
| Norwegians | 90.2 /100 | #130 | Exceptional 15.9% |
| Nicaraguans | 90.1 /100 | #131 | Exceptional 15.9% |
| Immigrants | Portugal | 89.7 /100 | #132 | Excellent 15.9% |
| Immigrants | Syria | 89.5 /100 | #133 | Excellent 15.9% |
| Immigrants | South America | 88.5 /100 | #134 | Excellent 15.9% |
| Immigrants | Sri Lanka | 88.2 /100 | #135 | Excellent 15.9% |
| Cypriots | 87.5 /100 | #136 | Excellent 15.9% |
| Immigrants | Azores | 87.2 /100 | #137 | Excellent 15.9% |
Demographics Similar to Immigrants from South Eastern Asia by Single Father Poverty
In terms of single father poverty, the demographic groups most similar to Immigrants from South Eastern Asia are Immigrants from Egypt (14.4%, a difference of 0.010%), Iranian (14.4%, a difference of 0.030%), Taiwanese (14.3%, a difference of 0.21%), Spanish American Indian (14.4%, a difference of 0.46%), and Nepalese (14.4%, a difference of 0.51%).
| Demographics | Rating | Rank | Single Father Poverty |
| Immigrants | Hong Kong | 100.0 /100 | #17 | Exceptional 14.2% |
| Soviet Union | 100.0 /100 | #18 | Exceptional 14.3% |
| Immigrants | Iraq | 100.0 /100 | #19 | Exceptional 14.3% |
| Immigrants | Singapore | 100.0 /100 | #20 | Exceptional 14.3% |
| Immigrants | Afghanistan | 100.0 /100 | #21 | Exceptional 14.3% |
| Taiwanese | 100.0 /100 | #22 | Exceptional 14.3% |
| Immigrants | Egypt | 100.0 /100 | #23 | Exceptional 14.4% |
| Immigrants | South Eastern Asia | 100.0 /100 | #24 | Exceptional 14.4% |
| Iranians | 100.0 /100 | #25 | Exceptional 14.4% |
| Spanish American Indians | 100.0 /100 | #26 | Exceptional 14.4% |
| Nepalese | 100.0 /100 | #27 | Exceptional 14.4% |
| Immigrants | South Central Asia | 100.0 /100 | #28 | Exceptional 14.5% |
| Somalis | 100.0 /100 | #29 | Exceptional 14.5% |
| Thais | 100.0 /100 | #30 | Exceptional 14.5% |
| Icelanders | 100.0 /100 | #31 | Exceptional 14.5% |