Immigrants from Caribbean vs Immigrants from South Eastern Asia Single Father Poverty
COMPARE
Immigrants from Caribbean
Immigrants from South Eastern Asia
Single Father Poverty
Single Father Poverty Comparison
Immigrants from Caribbean
Immigrants from South Eastern Asia
17.4%
SINGLE FATHER POVERTY
0.3/ 100
METRIC RATING
268th/ 347
METRIC RANK
14.4%
SINGLE FATHER POVERTY
100.0/ 100
METRIC RATING
24th/ 347
METRIC RANK
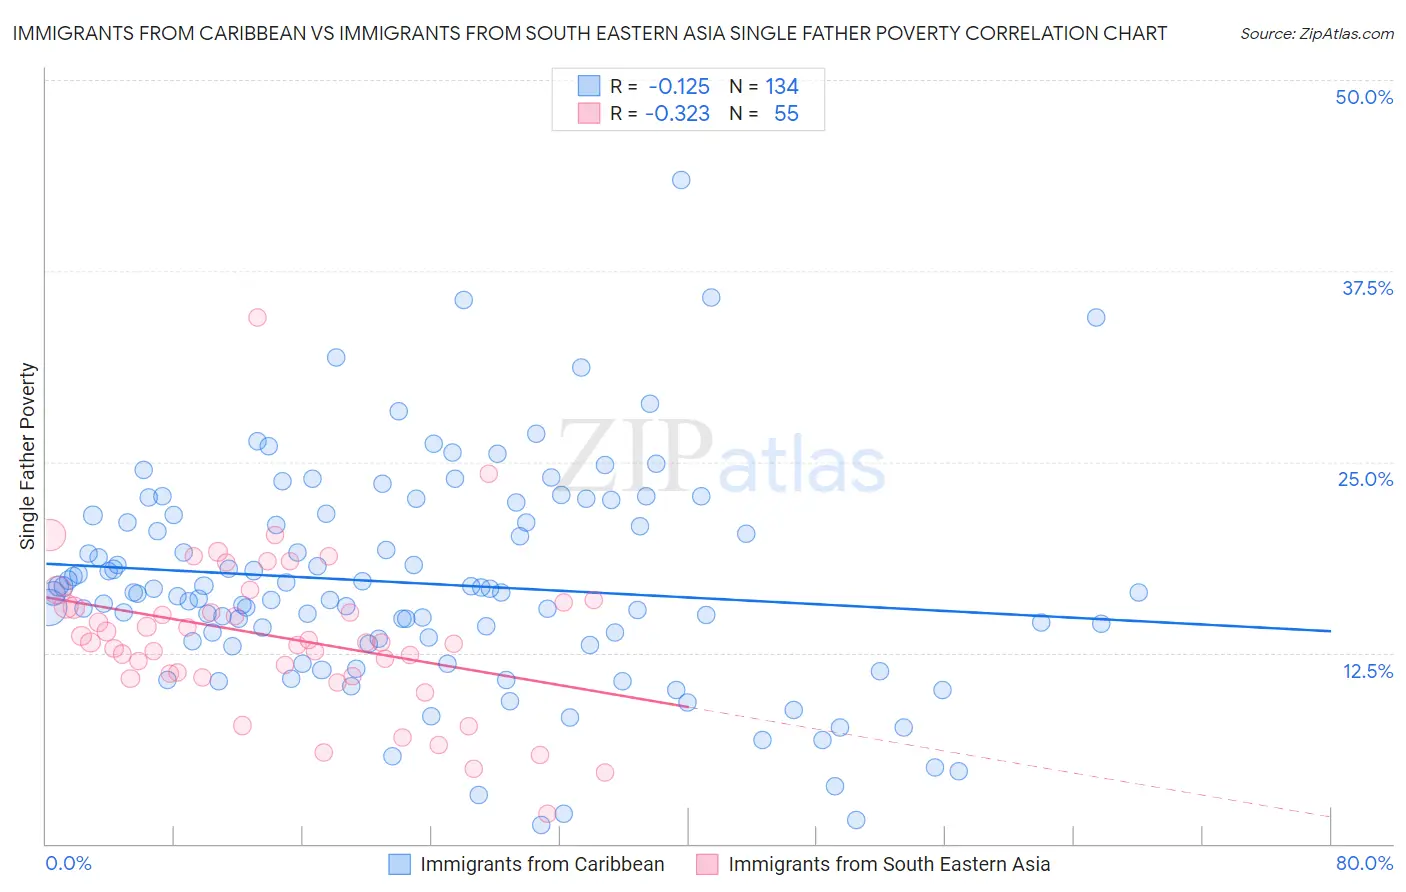
Immigrants from Caribbean vs Immigrants from South Eastern Asia Single Father Poverty Correlation Chart
The statistical analysis conducted on geographies consisting of 347,686,703 people shows a poor negative correlation between the proportion of Immigrants from Caribbean and poverty level among single fathers in the United States with a correlation coefficient (R) of -0.125 and weighted average of 17.4%. Similarly, the statistical analysis conducted on geographies consisting of 383,820,731 people shows a mild negative correlation between the proportion of Immigrants from South Eastern Asia and poverty level among single fathers in the United States with a correlation coefficient (R) of -0.323 and weighted average of 14.4%, a difference of 20.9%.
Single Father Poverty Correlation Summary
| Measurement | Immigrants from Caribbean | Immigrants from South Eastern Asia |
| Minimum | 1.2% | 2.0% |
| Maximum | 43.5% | 34.5% |
| Range | 42.3% | 32.5% |
| Mean | 17.0% | 13.5% |
| Median | 16.4% | 13.2% |
| Interquartile 25% (IQ1) | 13.3% | 11.0% |
| Interquartile 75% (IQ3) | 21.5% | 15.8% |
| Interquartile Range (IQR) | 8.2% | 4.8% |
| Standard Deviation (Sample) | 7.1% | 5.2% |
| Standard Deviation (Population) | 7.1% | 5.2% |
Similar Demographics by Single Father Poverty
Demographics Similar to Immigrants from Caribbean by Single Father Poverty
In terms of single father poverty, the demographic groups most similar to Immigrants from Caribbean are Slavic (17.4%, a difference of 0.070%), Haitian (17.3%, a difference of 0.10%), Jamaican (17.3%, a difference of 0.14%), Polish (17.3%, a difference of 0.19%), and Slovene (17.3%, a difference of 0.20%).
| Demographics | Rating | Rank | Single Father Poverty |
| Swiss | 0.5 /100 | #261 | Tragic 17.3% |
| Immigrants | Zaire | 0.4 /100 | #262 | Tragic 17.3% |
| Lithuanians | 0.4 /100 | #263 | Tragic 17.3% |
| Slovenes | 0.3 /100 | #264 | Tragic 17.3% |
| Poles | 0.3 /100 | #265 | Tragic 17.3% |
| Jamaicans | 0.3 /100 | #266 | Tragic 17.3% |
| Haitians | 0.3 /100 | #267 | Tragic 17.3% |
| Immigrants | Caribbean | 0.3 /100 | #268 | Tragic 17.4% |
| Slavs | 0.3 /100 | #269 | Tragic 17.4% |
| Indonesians | 0.2 /100 | #270 | Tragic 17.4% |
| French American Indians | 0.2 /100 | #271 | Tragic 17.4% |
| Barbadians | 0.1 /100 | #272 | Tragic 17.5% |
| Italians | 0.1 /100 | #273 | Tragic 17.5% |
| Macedonians | 0.1 /100 | #274 | Tragic 17.7% |
| British West Indians | 0.0 /100 | #275 | Tragic 17.7% |
Demographics Similar to Immigrants from South Eastern Asia by Single Father Poverty
In terms of single father poverty, the demographic groups most similar to Immigrants from South Eastern Asia are Immigrants from Egypt (14.4%, a difference of 0.010%), Iranian (14.4%, a difference of 0.030%), Taiwanese (14.3%, a difference of 0.21%), Spanish American Indian (14.4%, a difference of 0.46%), and Nepalese (14.4%, a difference of 0.51%).
| Demographics | Rating | Rank | Single Father Poverty |
| Immigrants | Hong Kong | 100.0 /100 | #17 | Exceptional 14.2% |
| Soviet Union | 100.0 /100 | #18 | Exceptional 14.3% |
| Immigrants | Iraq | 100.0 /100 | #19 | Exceptional 14.3% |
| Immigrants | Singapore | 100.0 /100 | #20 | Exceptional 14.3% |
| Immigrants | Afghanistan | 100.0 /100 | #21 | Exceptional 14.3% |
| Taiwanese | 100.0 /100 | #22 | Exceptional 14.3% |
| Immigrants | Egypt | 100.0 /100 | #23 | Exceptional 14.4% |
| Immigrants | South Eastern Asia | 100.0 /100 | #24 | Exceptional 14.4% |
| Iranians | 100.0 /100 | #25 | Exceptional 14.4% |
| Spanish American Indians | 100.0 /100 | #26 | Exceptional 14.4% |
| Nepalese | 100.0 /100 | #27 | Exceptional 14.4% |
| Immigrants | South Central Asia | 100.0 /100 | #28 | Exceptional 14.5% |
| Somalis | 100.0 /100 | #29 | Exceptional 14.5% |
| Thais | 100.0 /100 | #30 | Exceptional 14.5% |
| Icelanders | 100.0 /100 | #31 | Exceptional 14.5% |