Filipino vs Immigrants from South Eastern Asia Single Father Poverty
COMPARE
Filipino
Immigrants from South Eastern Asia
Single Father Poverty
Single Father Poverty Comparison
Filipinos
Immigrants from South Eastern Asia
14.0%
SINGLE FATHER POVERTY
100.0/ 100
METRIC RATING
11th/ 347
METRIC RANK
14.4%
SINGLE FATHER POVERTY
100.0/ 100
METRIC RATING
24th/ 347
METRIC RANK
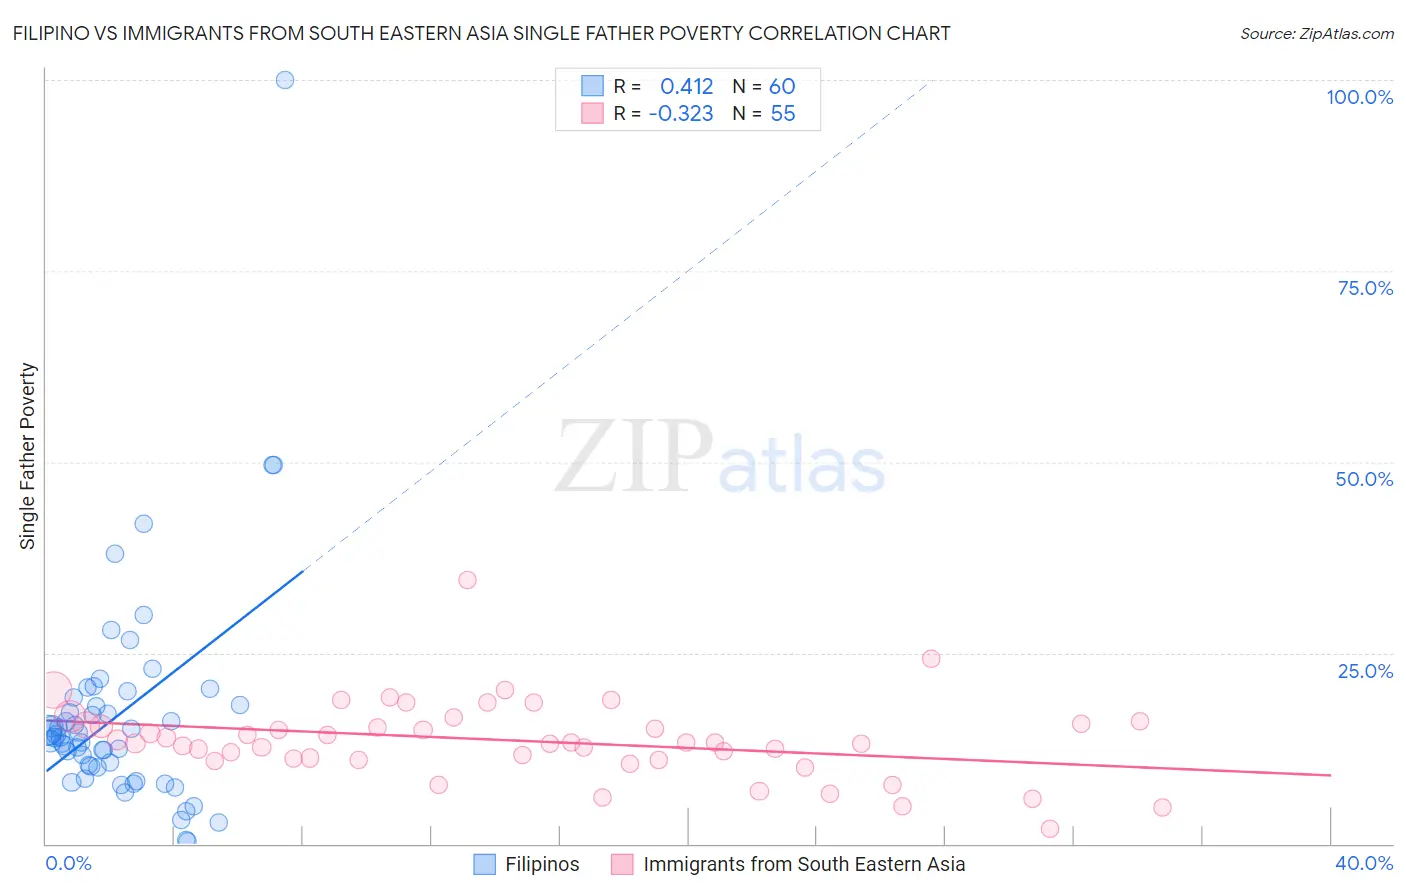
Filipino vs Immigrants from South Eastern Asia Single Father Poverty Correlation Chart
The statistical analysis conducted on geographies consisting of 206,291,674 people shows a moderate positive correlation between the proportion of Filipinos and poverty level among single fathers in the United States with a correlation coefficient (R) of 0.412 and weighted average of 14.0%. Similarly, the statistical analysis conducted on geographies consisting of 383,820,731 people shows a mild negative correlation between the proportion of Immigrants from South Eastern Asia and poverty level among single fathers in the United States with a correlation coefficient (R) of -0.323 and weighted average of 14.4%, a difference of 2.3%.
Single Father Poverty Correlation Summary
| Measurement | Filipino | Immigrants from South Eastern Asia |
| Minimum | 0.30% | 2.0% |
| Maximum | 100.0% | 34.5% |
| Range | 99.7% | 32.5% |
| Mean | 17.0% | 13.5% |
| Median | 14.1% | 13.2% |
| Interquartile 25% (IQ1) | 10.1% | 11.0% |
| Interquartile 75% (IQ3) | 18.7% | 15.8% |
| Interquartile Range (IQR) | 8.6% | 4.8% |
| Standard Deviation (Sample) | 14.8% | 5.2% |
| Standard Deviation (Population) | 14.7% | 5.2% |
Demographics Similar to Filipinos and Immigrants from South Eastern Asia by Single Father Poverty
In terms of single father poverty, the demographic groups most similar to Filipinos are Immigrants from India (14.0%, a difference of 0.0%), Immigrants from Philippines (14.0%, a difference of 0.15%), Korean (14.0%, a difference of 0.40%), Afghan (14.0%, a difference of 0.51%), and Immigrants from Vietnam (14.1%, a difference of 0.85%). Similarly, the demographic groups most similar to Immigrants from South Eastern Asia are Immigrants from Egypt (14.4%, a difference of 0.010%), Iranian (14.4%, a difference of 0.030%), Taiwanese (14.3%, a difference of 0.21%), Spanish American Indian (14.4%, a difference of 0.46%), and Nepalese (14.4%, a difference of 0.51%).
| Demographics | Rating | Rank | Single Father Poverty |
| Immigrants | Taiwan | 100.0 /100 | #7 | Exceptional 13.7% |
| Samoans | 100.0 /100 | #8 | Exceptional 13.8% |
| Afghans | 100.0 /100 | #9 | Exceptional 14.0% |
| Koreans | 100.0 /100 | #10 | Exceptional 14.0% |
| Filipinos | 100.0 /100 | #11 | Exceptional 14.0% |
| Immigrants | India | 100.0 /100 | #12 | Exceptional 14.0% |
| Immigrants | Philippines | 100.0 /100 | #13 | Exceptional 14.0% |
| Immigrants | Vietnam | 100.0 /100 | #14 | Exceptional 14.1% |
| Sri Lankans | 100.0 /100 | #15 | Exceptional 14.2% |
| Immigrants | Iran | 100.0 /100 | #16 | Exceptional 14.2% |
| Immigrants | Hong Kong | 100.0 /100 | #17 | Exceptional 14.2% |
| Soviet Union | 100.0 /100 | #18 | Exceptional 14.3% |
| Immigrants | Iraq | 100.0 /100 | #19 | Exceptional 14.3% |
| Immigrants | Singapore | 100.0 /100 | #20 | Exceptional 14.3% |
| Immigrants | Afghanistan | 100.0 /100 | #21 | Exceptional 14.3% |
| Taiwanese | 100.0 /100 | #22 | Exceptional 14.3% |
| Immigrants | Egypt | 100.0 /100 | #23 | Exceptional 14.4% |
| Immigrants | South Eastern Asia | 100.0 /100 | #24 | Exceptional 14.4% |
| Iranians | 100.0 /100 | #25 | Exceptional 14.4% |
| Spanish American Indians | 100.0 /100 | #26 | Exceptional 14.4% |
| Nepalese | 100.0 /100 | #27 | Exceptional 14.4% |