Northern European vs Immigrants from Costa Rica Seniors Poverty Over the Age of 75
COMPARE
Northern European
Immigrants from Costa Rica
Seniors Poverty Over the Age of 75
Seniors Poverty Over the Age of 75 Comparison
Northern Europeans
Immigrants from Costa Rica
10.7%
SENIORS POVERTY OVER THE AGE OF 75
99.8/ 100
METRIC RATING
27th/ 347
METRIC RANK
13.3%
SENIORS POVERTY OVER THE AGE OF 75
1.3/ 100
METRIC RATING
233rd/ 347
METRIC RANK
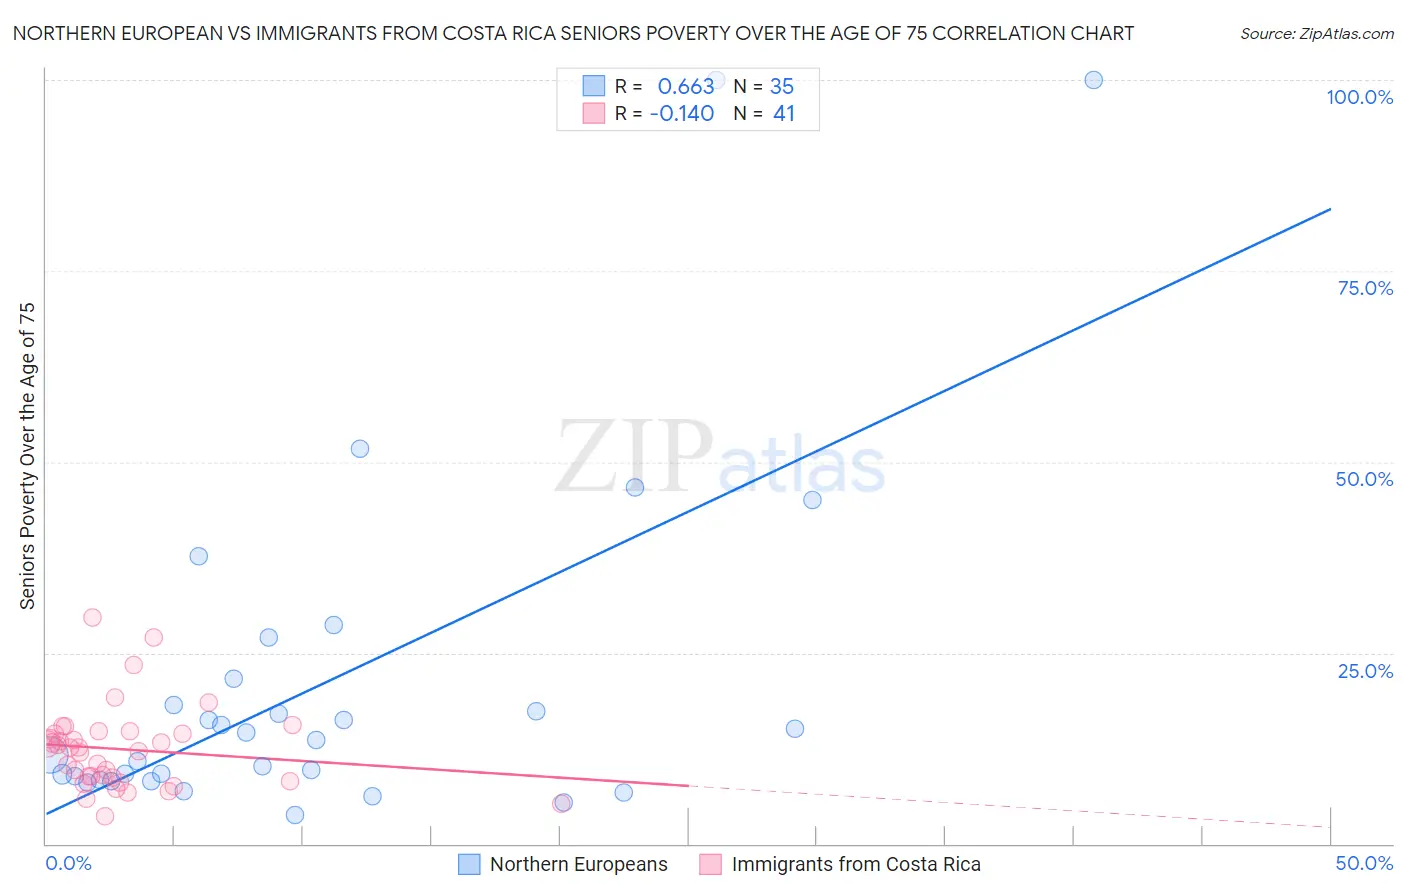
Northern European vs Immigrants from Costa Rica Seniors Poverty Over the Age of 75 Correlation Chart
The statistical analysis conducted on geographies consisting of 400,431,861 people shows a significant positive correlation between the proportion of Northern Europeans and poverty level among seniors over the age of 75 in the United States with a correlation coefficient (R) of 0.663 and weighted average of 10.7%. Similarly, the statistical analysis conducted on geographies consisting of 203,329,700 people shows a poor negative correlation between the proportion of Immigrants from Costa Rica and poverty level among seniors over the age of 75 in the United States with a correlation coefficient (R) of -0.140 and weighted average of 13.3%, a difference of 24.1%.
Seniors Poverty Over the Age of 75 Correlation Summary
| Measurement | Northern European | Immigrants from Costa Rica |
| Minimum | 3.8% | 3.5% |
| Maximum | 100.0% | 29.6% |
| Range | 96.2% | 26.0% |
| Mean | 21.2% | 12.4% |
| Median | 13.5% | 12.6% |
| Interquartile 25% (IQ1) | 8.3% | 8.4% |
| Interquartile 75% (IQ3) | 21.6% | 14.6% |
| Interquartile Range (IQR) | 13.4% | 6.2% |
| Standard Deviation (Sample) | 23.1% | 5.4% |
| Standard Deviation (Population) | 22.7% | 5.4% |
Similar Demographics by Seniors Poverty Over the Age of 75
Demographics Similar to Northern Europeans by Seniors Poverty Over the Age of 75
In terms of seniors poverty over the age of 75, the demographic groups most similar to Northern Europeans are Irish (10.7%, a difference of 0.060%), Assyrian/Chaldean/Syriac (10.7%, a difference of 0.21%), Bulgarian (10.7%, a difference of 0.27%), Swiss (10.7%, a difference of 0.29%), and Marshallese (10.7%, a difference of 0.48%).
| Demographics | Rating | Rank | Seniors Poverty Over the Age of 75 |
| Czechs | 99.9 /100 | #20 | Exceptional 10.5% |
| Slovenes | 99.9 /100 | #21 | Exceptional 10.6% |
| Bhutanese | 99.8 /100 | #22 | Exceptional 10.6% |
| Lithuanians | 99.8 /100 | #23 | Exceptional 10.6% |
| Poles | 99.8 /100 | #24 | Exceptional 10.6% |
| Menominee | 99.8 /100 | #25 | Exceptional 10.6% |
| Bulgarians | 99.8 /100 | #26 | Exceptional 10.7% |
| Northern Europeans | 99.8 /100 | #27 | Exceptional 10.7% |
| Irish | 99.8 /100 | #28 | Exceptional 10.7% |
| Assyrians/Chaldeans/Syriacs | 99.8 /100 | #29 | Exceptional 10.7% |
| Swiss | 99.7 /100 | #30 | Exceptional 10.7% |
| Marshallese | 99.7 /100 | #31 | Exceptional 10.7% |
| British | 99.7 /100 | #32 | Exceptional 10.7% |
| Puget Sound Salish | 99.7 /100 | #33 | Exceptional 10.8% |
| Italians | 99.7 /100 | #34 | Exceptional 10.8% |
Demographics Similar to Immigrants from Costa Rica by Seniors Poverty Over the Age of 75
In terms of seniors poverty over the age of 75, the demographic groups most similar to Immigrants from Costa Rica are Immigrants from Chile (13.3%, a difference of 0.030%), Subsaharan African (13.2%, a difference of 0.23%), Immigrants from China (13.2%, a difference of 0.24%), Somali (13.2%, a difference of 0.33%), and Immigrants from Israel (13.3%, a difference of 0.35%).
| Demographics | Rating | Rank | Seniors Poverty Over the Age of 75 |
| Shoshone | 2.6 /100 | #226 | Tragic 13.1% |
| Cree | 2.3 /100 | #227 | Tragic 13.1% |
| Israelis | 2.0 /100 | #228 | Tragic 13.2% |
| Somalis | 1.6 /100 | #229 | Tragic 13.2% |
| Immigrants | China | 1.5 /100 | #230 | Tragic 13.2% |
| Sub-Saharan Africans | 1.5 /100 | #231 | Tragic 13.2% |
| Immigrants | Chile | 1.3 /100 | #232 | Tragic 13.3% |
| Immigrants | Costa Rica | 1.3 /100 | #233 | Tragic 13.3% |
| Immigrants | Israel | 1.1 /100 | #234 | Tragic 13.3% |
| Japanese | 0.9 /100 | #235 | Tragic 13.3% |
| Moroccans | 0.9 /100 | #236 | Tragic 13.3% |
| Alaskan Athabascans | 0.8 /100 | #237 | Tragic 13.4% |
| Peruvians | 0.8 /100 | #238 | Tragic 13.4% |
| Panamanians | 0.8 /100 | #239 | Tragic 13.4% |
| Argentineans | 0.7 /100 | #240 | Tragic 13.4% |