Northern European vs Hawaiian Seniors Poverty Over the Age of 75
COMPARE
Northern European
Hawaiian
Seniors Poverty Over the Age of 75
Seniors Poverty Over the Age of 75 Comparison
Northern Europeans
Hawaiians
10.7%
SENIORS POVERTY OVER THE AGE OF 75
99.8/ 100
METRIC RATING
27th/ 347
METRIC RANK
11.1%
SENIORS POVERTY OVER THE AGE OF 75
98.8/ 100
METRIC RATING
47th/ 347
METRIC RANK
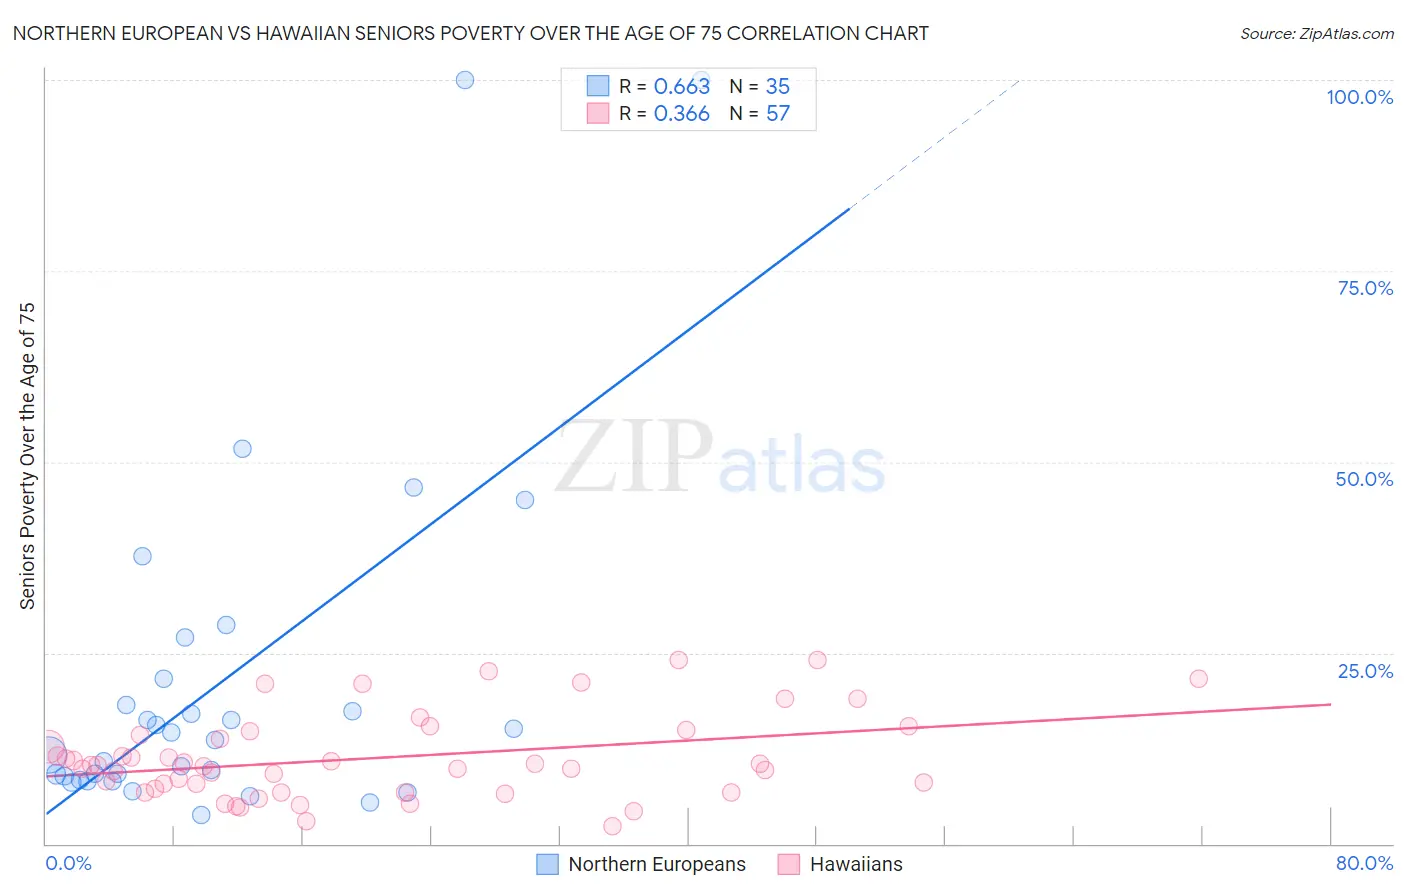
Northern European vs Hawaiian Seniors Poverty Over the Age of 75 Correlation Chart
The statistical analysis conducted on geographies consisting of 400,431,861 people shows a significant positive correlation between the proportion of Northern Europeans and poverty level among seniors over the age of 75 in the United States with a correlation coefficient (R) of 0.663 and weighted average of 10.7%. Similarly, the statistical analysis conducted on geographies consisting of 324,075,554 people shows a mild positive correlation between the proportion of Hawaiians and poverty level among seniors over the age of 75 in the United States with a correlation coefficient (R) of 0.366 and weighted average of 11.1%, a difference of 4.0%.
Seniors Poverty Over the Age of 75 Correlation Summary
| Measurement | Northern European | Hawaiian |
| Minimum | 3.8% | 2.3% |
| Maximum | 100.0% | 24.1% |
| Range | 96.2% | 21.8% |
| Mean | 21.2% | 11.2% |
| Median | 13.5% | 10.3% |
| Interquartile 25% (IQ1) | 8.3% | 7.0% |
| Interquartile 75% (IQ3) | 21.6% | 14.5% |
| Interquartile Range (IQR) | 13.4% | 7.5% |
| Standard Deviation (Sample) | 23.1% | 5.5% |
| Standard Deviation (Population) | 22.7% | 5.4% |
Demographics Similar to Northern Europeans and Hawaiians by Seniors Poverty Over the Age of 75
In terms of seniors poverty over the age of 75, the demographic groups most similar to Northern Europeans are Irish (10.7%, a difference of 0.060%), Assyrian/Chaldean/Syriac (10.7%, a difference of 0.21%), Swiss (10.7%, a difference of 0.29%), Marshallese (10.7%, a difference of 0.48%), and British (10.7%, a difference of 0.62%). Similarly, the demographic groups most similar to Hawaiians are Greek (11.1%, a difference of 0.44%), Carpatho Rusyn (11.1%, a difference of 0.50%), Belgian (11.0%, a difference of 0.78%), Celtic (11.0%, a difference of 0.81%), and Austrian (11.0%, a difference of 0.86%).
| Demographics | Rating | Rank | Seniors Poverty Over the Age of 75 |
| Northern Europeans | 99.8 /100 | #27 | Exceptional 10.7% |
| Irish | 99.8 /100 | #28 | Exceptional 10.7% |
| Assyrians/Chaldeans/Syriacs | 99.8 /100 | #29 | Exceptional 10.7% |
| Swiss | 99.7 /100 | #30 | Exceptional 10.7% |
| Marshallese | 99.7 /100 | #31 | Exceptional 10.7% |
| British | 99.7 /100 | #32 | Exceptional 10.7% |
| Puget Sound Salish | 99.7 /100 | #33 | Exceptional 10.8% |
| Italians | 99.7 /100 | #34 | Exceptional 10.8% |
| Luxembourgers | 99.6 /100 | #35 | Exceptional 10.8% |
| Scotch-Irish | 99.6 /100 | #36 | Exceptional 10.8% |
| Latvians | 99.6 /100 | #37 | Exceptional 10.8% |
| Finns | 99.6 /100 | #38 | Exceptional 10.8% |
| Czechoslovakians | 99.4 /100 | #39 | Exceptional 10.9% |
| Thais | 99.4 /100 | #40 | Exceptional 10.9% |
| Immigrants | Lithuania | 99.2 /100 | #41 | Exceptional 11.0% |
| Austrians | 99.1 /100 | #42 | Exceptional 11.0% |
| Celtics | 99.1 /100 | #43 | Exceptional 11.0% |
| Belgians | 99.1 /100 | #44 | Exceptional 11.0% |
| Carpatho Rusyns | 99.0 /100 | #45 | Exceptional 11.1% |
| Greeks | 99.0 /100 | #46 | Exceptional 11.1% |
| Hawaiians | 98.8 /100 | #47 | Exceptional 11.1% |