Zimbabwean vs Immigrants from Costa Rica Seniors Poverty Over the Age of 75
COMPARE
Zimbabwean
Immigrants from Costa Rica
Seniors Poverty Over the Age of 75
Seniors Poverty Over the Age of 75 Comparison
Zimbabweans
Immigrants from Costa Rica
11.2%
SENIORS POVERTY OVER THE AGE OF 75
98.5/ 100
METRIC RATING
52nd/ 347
METRIC RANK
13.3%
SENIORS POVERTY OVER THE AGE OF 75
1.3/ 100
METRIC RATING
233rd/ 347
METRIC RANK
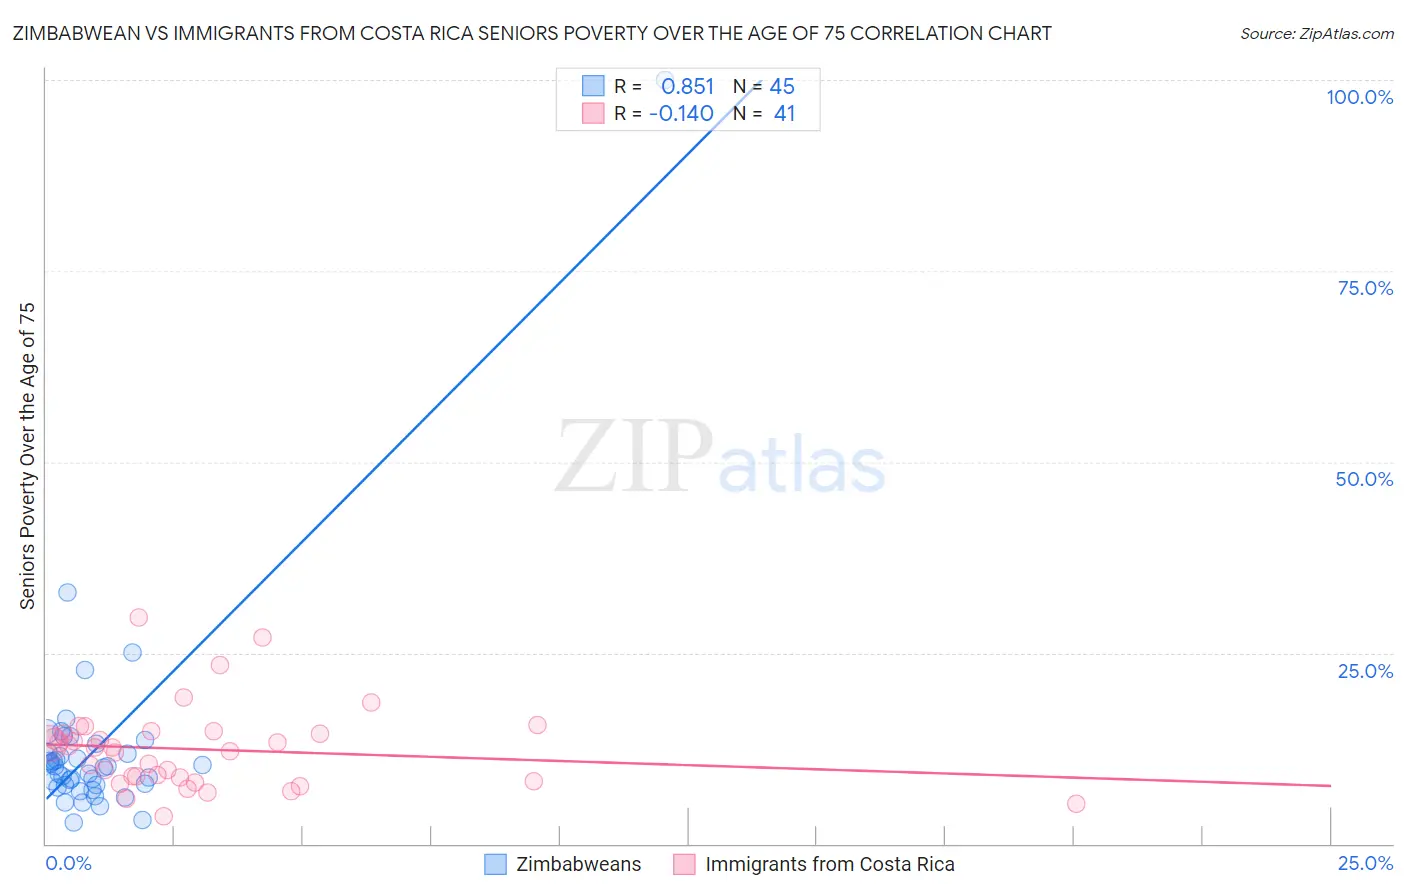
Zimbabwean vs Immigrants from Costa Rica Seniors Poverty Over the Age of 75 Correlation Chart
The statistical analysis conducted on geographies consisting of 68,929,819 people shows a very strong positive correlation between the proportion of Zimbabweans and poverty level among seniors over the age of 75 in the United States with a correlation coefficient (R) of 0.851 and weighted average of 11.2%. Similarly, the statistical analysis conducted on geographies consisting of 203,329,700 people shows a poor negative correlation between the proportion of Immigrants from Costa Rica and poverty level among seniors over the age of 75 in the United States with a correlation coefficient (R) of -0.140 and weighted average of 13.3%, a difference of 18.8%.
Seniors Poverty Over the Age of 75 Correlation Summary
| Measurement | Zimbabwean | Immigrants from Costa Rica |
| Minimum | 2.7% | 3.5% |
| Maximum | 100.0% | 29.6% |
| Range | 97.3% | 26.0% |
| Mean | 12.7% | 12.4% |
| Median | 10.2% | 12.6% |
| Interquartile 25% (IQ1) | 7.6% | 8.4% |
| Interquartile 75% (IQ3) | 12.5% | 14.6% |
| Interquartile Range (IQR) | 4.9% | 6.2% |
| Standard Deviation (Sample) | 14.4% | 5.4% |
| Standard Deviation (Population) | 14.2% | 5.4% |
Similar Demographics by Seniors Poverty Over the Age of 75
Demographics Similar to Zimbabweans by Seniors Poverty Over the Age of 75
In terms of seniors poverty over the age of 75, the demographic groups most similar to Zimbabweans are Immigrants from England (11.2%, a difference of 0.070%), Immigrants from North Macedonia (11.1%, a difference of 0.16%), Serbian (11.1%, a difference of 0.18%), Samoan (11.1%, a difference of 0.29%), and Afghan (11.2%, a difference of 0.38%).
| Demographics | Rating | Rank | Seniors Poverty Over the Age of 75 |
| Carpatho Rusyns | 99.0 /100 | #45 | Exceptional 11.1% |
| Greeks | 99.0 /100 | #46 | Exceptional 11.1% |
| Hawaiians | 98.8 /100 | #47 | Exceptional 11.1% |
| French | 98.7 /100 | #48 | Exceptional 11.1% |
| Samoans | 98.7 /100 | #49 | Exceptional 11.1% |
| Serbians | 98.6 /100 | #50 | Exceptional 11.1% |
| Immigrants | North Macedonia | 98.6 /100 | #51 | Exceptional 11.1% |
| Zimbabweans | 98.5 /100 | #52 | Exceptional 11.2% |
| Immigrants | England | 98.4 /100 | #53 | Exceptional 11.2% |
| Afghans | 98.2 /100 | #54 | Exceptional 11.2% |
| Hungarians | 98.1 /100 | #55 | Exceptional 11.2% |
| Slavs | 98.1 /100 | #56 | Exceptional 11.2% |
| Immigrants | Canada | 97.9 /100 | #57 | Exceptional 11.2% |
| Yugoslavians | 97.9 /100 | #58 | Exceptional 11.2% |
| Immigrants | Netherlands | 97.8 /100 | #59 | Exceptional 11.2% |
Demographics Similar to Immigrants from Costa Rica by Seniors Poverty Over the Age of 75
In terms of seniors poverty over the age of 75, the demographic groups most similar to Immigrants from Costa Rica are Immigrants from Chile (13.3%, a difference of 0.030%), Subsaharan African (13.2%, a difference of 0.23%), Immigrants from China (13.2%, a difference of 0.24%), Somali (13.2%, a difference of 0.33%), and Immigrants from Israel (13.3%, a difference of 0.35%).
| Demographics | Rating | Rank | Seniors Poverty Over the Age of 75 |
| Shoshone | 2.6 /100 | #226 | Tragic 13.1% |
| Cree | 2.3 /100 | #227 | Tragic 13.1% |
| Israelis | 2.0 /100 | #228 | Tragic 13.2% |
| Somalis | 1.6 /100 | #229 | Tragic 13.2% |
| Immigrants | China | 1.5 /100 | #230 | Tragic 13.2% |
| Sub-Saharan Africans | 1.5 /100 | #231 | Tragic 13.2% |
| Immigrants | Chile | 1.3 /100 | #232 | Tragic 13.3% |
| Immigrants | Costa Rica | 1.3 /100 | #233 | Tragic 13.3% |
| Immigrants | Israel | 1.1 /100 | #234 | Tragic 13.3% |
| Japanese | 0.9 /100 | #235 | Tragic 13.3% |
| Moroccans | 0.9 /100 | #236 | Tragic 13.3% |
| Alaskan Athabascans | 0.8 /100 | #237 | Tragic 13.4% |
| Peruvians | 0.8 /100 | #238 | Tragic 13.4% |
| Panamanians | 0.8 /100 | #239 | Tragic 13.4% |
| Argentineans | 0.7 /100 | #240 | Tragic 13.4% |