Northern European vs Houma Single Mother Poverty
COMPARE
Northern European
Houma
Single Mother Poverty
Single Mother Poverty Comparison
Northern Europeans
Houma
28.6%
SINGLE MOTHER POVERTY
81.7/ 100
METRIC RATING
150th/ 347
METRIC RANK
43.5%
SINGLE MOTHER POVERTY
0.0/ 100
METRIC RATING
346th/ 347
METRIC RANK
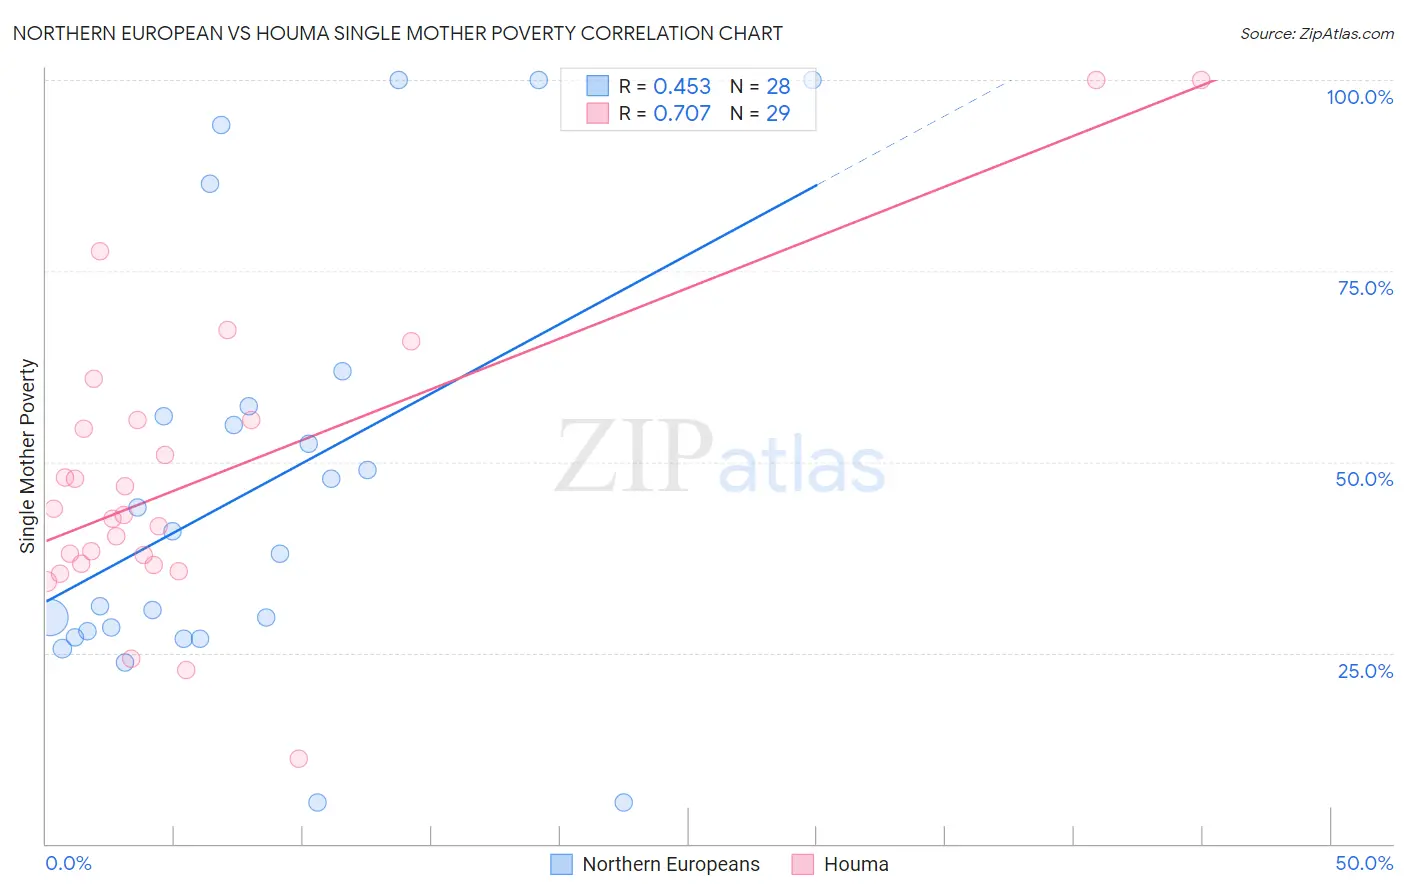
Northern European vs Houma Single Mother Poverty Correlation Chart
The statistical analysis conducted on geographies consisting of 394,065,574 people shows a moderate positive correlation between the proportion of Northern Europeans and poverty level among single mothers in the United States with a correlation coefficient (R) of 0.453 and weighted average of 28.6%. Similarly, the statistical analysis conducted on geographies consisting of 36,707,466 people shows a strong positive correlation between the proportion of Houma and poverty level among single mothers in the United States with a correlation coefficient (R) of 0.707 and weighted average of 43.5%, a difference of 51.9%.
Single Mother Poverty Correlation Summary
| Measurement | Northern European | Houma |
| Minimum | 5.4% | 11.1% |
| Maximum | 100.0% | 100.0% |
| Range | 94.6% | 88.9% |
| Mean | 46.4% | 48.0% |
| Median | 39.4% | 43.1% |
| Interquartile 25% (IQ1) | 27.4% | 36.6% |
| Interquartile 75% (IQ3) | 56.6% | 55.5% |
| Interquartile Range (IQR) | 29.2% | 19.0% |
| Standard Deviation (Sample) | 27.4% | 19.9% |
| Standard Deviation (Population) | 26.9% | 19.6% |
Similar Demographics by Single Mother Poverty
Demographics Similar to Northern Europeans by Single Mother Poverty
In terms of single mother poverty, the demographic groups most similar to Northern Europeans are Immigrants from Oceania (28.7%, a difference of 0.14%), Austrian (28.7%, a difference of 0.21%), Serbian (28.6%, a difference of 0.30%), Syrian (28.6%, a difference of 0.32%), and Immigrants from Lebanon (28.6%, a difference of 0.33%).
| Demographics | Rating | Rank | Single Mother Poverty |
| Immigrants | North America | 86.5 /100 | #143 | Excellent 28.5% |
| Luxembourgers | 86.4 /100 | #144 | Excellent 28.5% |
| Immigrants | South America | 86.1 /100 | #145 | Excellent 28.5% |
| Immigrants | Denmark | 86.1 /100 | #146 | Excellent 28.5% |
| Immigrants | Lebanon | 85.3 /100 | #147 | Excellent 28.6% |
| Syrians | 85.3 /100 | #148 | Excellent 28.6% |
| Serbians | 85.0 /100 | #149 | Excellent 28.6% |
| Northern Europeans | 81.7 /100 | #150 | Excellent 28.6% |
| Immigrants | Oceania | 79.9 /100 | #151 | Good 28.7% |
| Austrians | 79.0 /100 | #152 | Good 28.7% |
| Slovenes | 76.4 /100 | #153 | Good 28.8% |
| Portuguese | 73.2 /100 | #154 | Good 28.8% |
| Ugandans | 71.7 /100 | #155 | Good 28.8% |
| Iraqis | 71.5 /100 | #156 | Good 28.8% |
| Immigrants | Western Europe | 71.1 /100 | #157 | Good 28.9% |
Demographics Similar to Houma by Single Mother Poverty
In terms of single mother poverty, the demographic groups most similar to Houma are Lumbee (43.2%, a difference of 0.62%), Tohono O'odham (43.0%, a difference of 1.1%), Puerto Rican (44.5%, a difference of 2.4%), Cajun (40.3%, a difference of 7.9%), and Navajo (40.2%, a difference of 8.2%).
| Demographics | Rating | Rank | Single Mother Poverty |
| Menominee | 0.0 /100 | #333 | Tragic 37.1% |
| Pueblo | 0.0 /100 | #334 | Tragic 37.2% |
| Yuman | 0.0 /100 | #335 | Tragic 37.8% |
| Cheyenne | 0.0 /100 | #336 | Tragic 38.5% |
| Immigrants | Yemen | 0.0 /100 | #337 | Tragic 38.5% |
| Pima | 0.0 /100 | #338 | Tragic 38.6% |
| Crow | 0.0 /100 | #339 | Tragic 38.6% |
| Sioux | 0.0 /100 | #340 | Tragic 38.8% |
| Colville | 0.0 /100 | #341 | Tragic 39.3% |
| Navajo | 0.0 /100 | #342 | Tragic 40.2% |
| Cajuns | 0.0 /100 | #343 | Tragic 40.3% |
| Tohono O'odham | 0.0 /100 | #344 | Tragic 43.0% |
| Lumbee | 0.0 /100 | #345 | Tragic 43.2% |
| Houma | 0.0 /100 | #346 | Tragic 43.5% |
| Puerto Ricans | 0.0 /100 | #347 | Tragic 44.5% |