Nonimmigrants vs Maltese Single Father Poverty
COMPARE
Nonimmigrants
Maltese
Single Father Poverty
Single Father Poverty Comparison
Nonimmigrants
Maltese
18.8%
SINGLE FATHER POVERTY
0.0/ 100
METRIC RATING
311th/ 347
METRIC RANK
15.3%
SINGLE FATHER POVERTY
99.6/ 100
METRIC RATING
74th/ 347
METRIC RANK
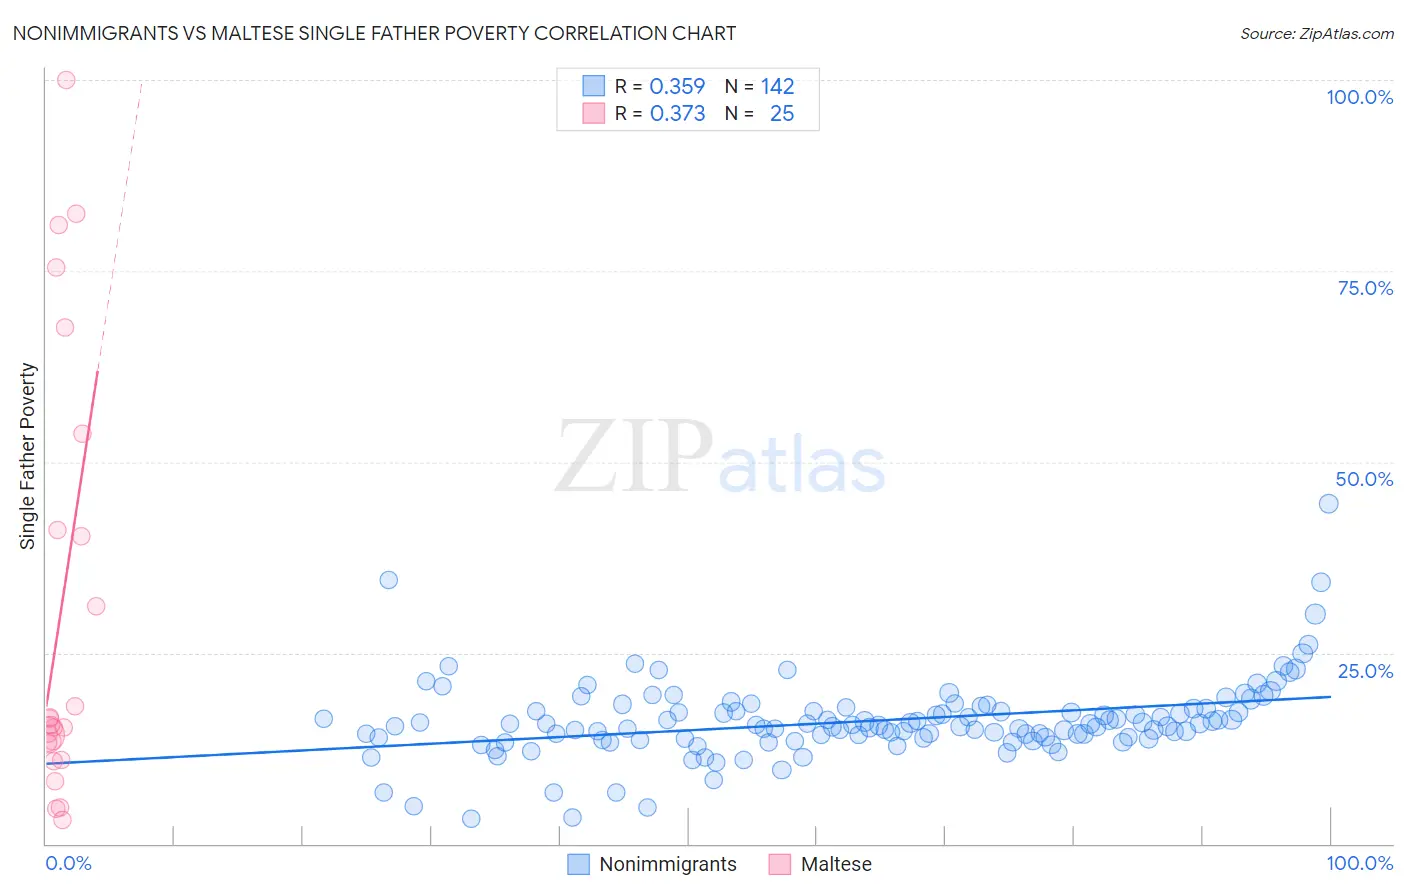
Nonimmigrants vs Maltese Single Father Poverty Correlation Chart
The statistical analysis conducted on geographies consisting of 414,706,444 people shows a mild positive correlation between the proportion of Nonimmigrants and poverty level among single fathers in the United States with a correlation coefficient (R) of 0.359 and weighted average of 18.8%. Similarly, the statistical analysis conducted on geographies consisting of 108,726,955 people shows a mild positive correlation between the proportion of Maltese and poverty level among single fathers in the United States with a correlation coefficient (R) of 0.373 and weighted average of 15.3%, a difference of 23.0%.
Single Father Poverty Correlation Summary
| Measurement | Nonimmigrants | Maltese |
| Minimum | 3.3% | 3.0% |
| Maximum | 44.5% | 100.0% |
| Range | 41.2% | 97.0% |
| Mean | 16.1% | 30.7% |
| Median | 15.5% | 15.5% |
| Interquartile 25% (IQ1) | 13.9% | 12.2% |
| Interquartile 75% (IQ3) | 17.6% | 47.4% |
| Interquartile Range (IQR) | 3.8% | 35.3% |
| Standard Deviation (Sample) | 5.2% | 28.8% |
| Standard Deviation (Population) | 5.2% | 28.2% |
Similar Demographics by Single Father Poverty
Demographics Similar to Nonimmigrants by Single Father Poverty
In terms of single father poverty, the demographic groups most similar to Nonimmigrants are Immigrants from Dominica (18.9%, a difference of 0.050%), Chippewa (18.8%, a difference of 0.19%), Potawatomi (18.9%, a difference of 0.25%), Delaware (18.9%, a difference of 0.42%), and Chickasaw (19.0%, a difference of 0.57%).
| Demographics | Rating | Rank | Single Father Poverty |
| Ute | 0.0 /100 | #304 | Tragic 18.5% |
| Blackfeet | 0.0 /100 | #305 | Tragic 18.5% |
| Scotch-Irish | 0.0 /100 | #306 | Tragic 18.6% |
| French Canadians | 0.0 /100 | #307 | Tragic 18.6% |
| Ottawa | 0.0 /100 | #308 | Tragic 18.6% |
| Immigrants | Micronesia | 0.0 /100 | #309 | Tragic 18.6% |
| Chippewa | 0.0 /100 | #310 | Tragic 18.8% |
| Immigrants | Nonimmigrants | 0.0 /100 | #311 | Tragic 18.8% |
| Immigrants | Dominica | 0.0 /100 | #312 | Tragic 18.9% |
| Potawatomi | 0.0 /100 | #313 | Tragic 18.9% |
| Delaware | 0.0 /100 | #314 | Tragic 18.9% |
| Chickasaw | 0.0 /100 | #315 | Tragic 19.0% |
| Osage | 0.0 /100 | #316 | Tragic 19.0% |
| Dominicans | 0.0 /100 | #317 | Tragic 19.1% |
| Dutch West Indians | 0.0 /100 | #318 | Tragic 19.2% |
Demographics Similar to Maltese by Single Father Poverty
In terms of single father poverty, the demographic groups most similar to Maltese are Immigrants from Turkey (15.3%, a difference of 0.020%), Kenyan (15.3%, a difference of 0.040%), Immigrants from Japan (15.3%, a difference of 0.10%), Immigrants from Peru (15.3%, a difference of 0.11%), and Immigrants from Lithuania (15.3%, a difference of 0.13%).
| Demographics | Rating | Rank | Single Father Poverty |
| Paraguayans | 99.7 /100 | #67 | Exceptional 15.2% |
| Immigrants | Cameroon | 99.7 /100 | #68 | Exceptional 15.2% |
| Japanese | 99.7 /100 | #69 | Exceptional 15.2% |
| Mongolians | 99.7 /100 | #70 | Exceptional 15.3% |
| Immigrants | Brazil | 99.6 /100 | #71 | Exceptional 15.3% |
| Immigrants | Lithuania | 99.6 /100 | #72 | Exceptional 15.3% |
| Kenyans | 99.6 /100 | #73 | Exceptional 15.3% |
| Maltese | 99.6 /100 | #74 | Exceptional 15.3% |
| Immigrants | Turkey | 99.5 /100 | #75 | Exceptional 15.3% |
| Immigrants | Japan | 99.5 /100 | #76 | Exceptional 15.3% |
| Immigrants | Peru | 99.5 /100 | #77 | Exceptional 15.3% |
| Tlingit-Haida | 99.5 /100 | #78 | Exceptional 15.3% |
| Immigrants | Northern Africa | 99.5 /100 | #79 | Exceptional 15.3% |
| Armenians | 99.4 /100 | #80 | Exceptional 15.4% |
| Immigrants | Congo | 99.4 /100 | #81 | Exceptional 15.4% |