Immigrants from France vs Maltese Single Father Poverty
COMPARE
Immigrants from France
Maltese
Single Father Poverty
Single Father Poverty Comparison
Immigrants from France
Maltese
16.1%
SINGLE FATHER POVERTY
73.1/ 100
METRIC RATING
151st/ 347
METRIC RANK
15.3%
SINGLE FATHER POVERTY
99.6/ 100
METRIC RATING
74th/ 347
METRIC RANK
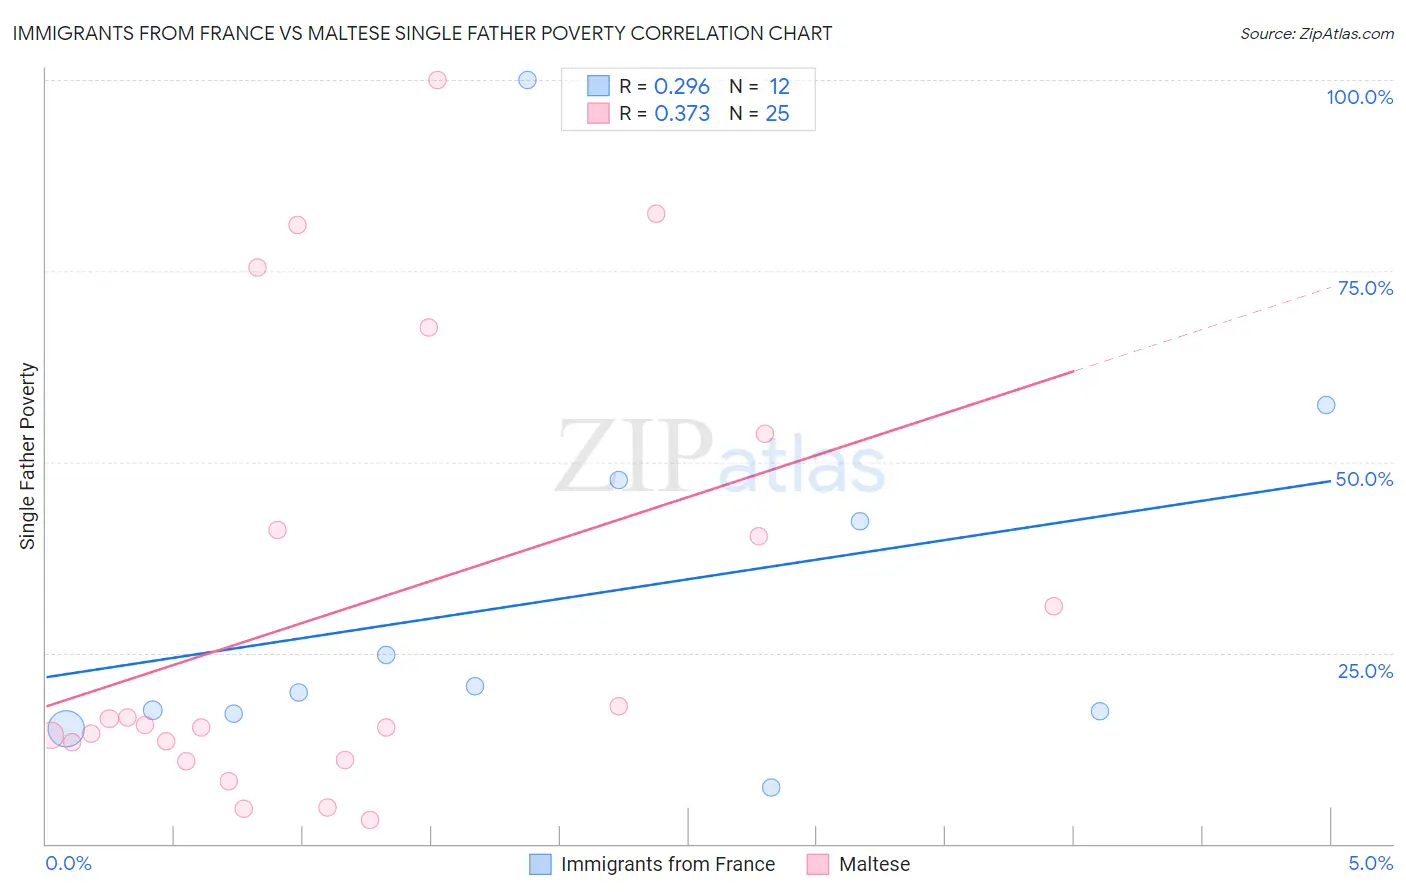
Immigrants from France vs Maltese Single Father Poverty Correlation Chart
The statistical analysis conducted on geographies consisting of 232,790,194 people shows a weak positive correlation between the proportion of Immigrants from France and poverty level among single fathers in the United States with a correlation coefficient (R) of 0.296 and weighted average of 16.1%. Similarly, the statistical analysis conducted on geographies consisting of 108,726,955 people shows a mild positive correlation between the proportion of Maltese and poverty level among single fathers in the United States with a correlation coefficient (R) of 0.373 and weighted average of 15.3%, a difference of 5.2%.
Single Father Poverty Correlation Summary
| Measurement | Immigrants from France | Maltese |
| Minimum | 7.4% | 3.0% |
| Maximum | 100.0% | 100.0% |
| Range | 92.6% | 97.0% |
| Mean | 32.2% | 30.7% |
| Median | 20.2% | 15.5% |
| Interquartile 25% (IQ1) | 17.2% | 12.2% |
| Interquartile 75% (IQ3) | 45.0% | 47.4% |
| Interquartile Range (IQR) | 27.8% | 35.3% |
| Standard Deviation (Sample) | 26.1% | 28.8% |
| Standard Deviation (Population) | 25.0% | 28.2% |
Similar Demographics by Single Father Poverty
Demographics Similar to Immigrants from France by Single Father Poverty
In terms of single father poverty, the demographic groups most similar to Immigrants from France are Jordanian (16.1%, a difference of 0.060%), Immigrants from Zimbabwe (16.1%, a difference of 0.060%), Immigrants from Israel (16.1%, a difference of 0.060%), South African (16.1%, a difference of 0.12%), and Mexican (16.1%, a difference of 0.16%).
| Demographics | Rating | Rank | Single Father Poverty |
| Immigrants | Kuwait | 81.4 /100 | #144 | Excellent 16.0% |
| Immigrants | Western Asia | 80.7 /100 | #145 | Excellent 16.0% |
| Immigrants | Hungary | 78.3 /100 | #146 | Good 16.1% |
| Colombians | 77.1 /100 | #147 | Good 16.1% |
| Nigerians | 76.8 /100 | #148 | Good 16.1% |
| South Africans | 75.1 /100 | #149 | Good 16.1% |
| Jordanians | 74.2 /100 | #150 | Good 16.1% |
| Immigrants | France | 73.1 /100 | #151 | Good 16.1% |
| Immigrants | Zimbabwe | 72.1 /100 | #152 | Good 16.1% |
| Immigrants | Israel | 72.0 /100 | #153 | Good 16.1% |
| Mexicans | 70.1 /100 | #154 | Good 16.1% |
| Immigrants | Nicaragua | 67.8 /100 | #155 | Good 16.2% |
| Immigrants | Jordan | 66.0 /100 | #156 | Good 16.2% |
| Immigrants | Czechoslovakia | 62.8 /100 | #157 | Good 16.2% |
| Portuguese | 62.3 /100 | #158 | Good 16.2% |
Demographics Similar to Maltese by Single Father Poverty
In terms of single father poverty, the demographic groups most similar to Maltese are Immigrants from Turkey (15.3%, a difference of 0.020%), Kenyan (15.3%, a difference of 0.040%), Immigrants from Japan (15.3%, a difference of 0.10%), Immigrants from Peru (15.3%, a difference of 0.11%), and Immigrants from Lithuania (15.3%, a difference of 0.13%).
| Demographics | Rating | Rank | Single Father Poverty |
| Paraguayans | 99.7 /100 | #67 | Exceptional 15.2% |
| Immigrants | Cameroon | 99.7 /100 | #68 | Exceptional 15.2% |
| Japanese | 99.7 /100 | #69 | Exceptional 15.2% |
| Mongolians | 99.7 /100 | #70 | Exceptional 15.3% |
| Immigrants | Brazil | 99.6 /100 | #71 | Exceptional 15.3% |
| Immigrants | Lithuania | 99.6 /100 | #72 | Exceptional 15.3% |
| Kenyans | 99.6 /100 | #73 | Exceptional 15.3% |
| Maltese | 99.6 /100 | #74 | Exceptional 15.3% |
| Immigrants | Turkey | 99.5 /100 | #75 | Exceptional 15.3% |
| Immigrants | Japan | 99.5 /100 | #76 | Exceptional 15.3% |
| Immigrants | Peru | 99.5 /100 | #77 | Exceptional 15.3% |
| Tlingit-Haida | 99.5 /100 | #78 | Exceptional 15.3% |
| Immigrants | Northern Africa | 99.5 /100 | #79 | Exceptional 15.3% |
| Armenians | 99.4 /100 | #80 | Exceptional 15.4% |
| Immigrants | Congo | 99.4 /100 | #81 | Exceptional 15.4% |