Nigerian vs Immigrants from Ethiopia Female Poverty Among 18-24 Year Olds
COMPARE
Nigerian
Immigrants from Ethiopia
Female Poverty Among 18-24 Year Olds
Female Poverty Among 18-24 Year Olds Comparison
Nigerians
Immigrants from Ethiopia
20.4%
FEMALE POVERTY AMONG 18-24 YEAR OLDS
23.4/ 100
METRIC RATING
193rd/ 347
METRIC RANK
20.2%
FEMALE POVERTY AMONG 18-24 YEAR OLDS
37.3/ 100
METRIC RATING
186th/ 347
METRIC RANK
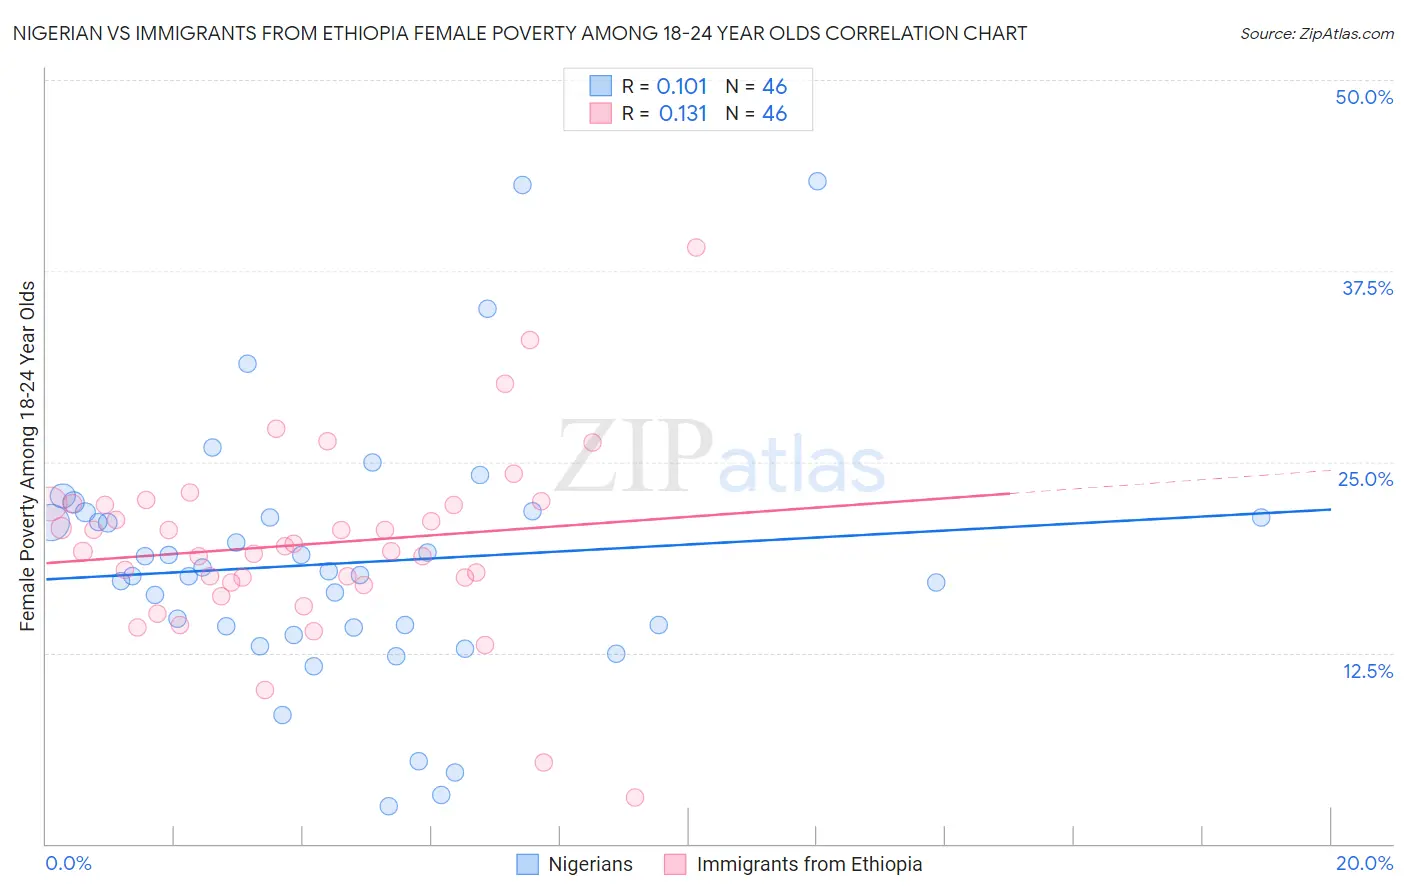
Nigerian vs Immigrants from Ethiopia Female Poverty Among 18-24 Year Olds Correlation Chart
The statistical analysis conducted on geographies consisting of 327,876,042 people shows a poor positive correlation between the proportion of Nigerians and poverty level among females between the ages 18 and 24 in the United States with a correlation coefficient (R) of 0.101 and weighted average of 20.4%. Similarly, the statistical analysis conducted on geographies consisting of 209,579,558 people shows a poor positive correlation between the proportion of Immigrants from Ethiopia and poverty level among females between the ages 18 and 24 in the United States with a correlation coefficient (R) of 0.131 and weighted average of 20.2%, a difference of 0.81%.
Female Poverty Among 18-24 Year Olds Correlation Summary
| Measurement | Nigerian | Immigrants from Ethiopia |
| Minimum | 2.5% | 3.0% |
| Maximum | 43.3% | 39.0% |
| Range | 40.9% | 36.0% |
| Mean | 18.4% | 19.6% |
| Median | 17.7% | 19.3% |
| Interquartile 25% (IQ1) | 14.2% | 17.1% |
| Interquartile 75% (IQ3) | 21.4% | 22.2% |
| Interquartile Range (IQR) | 7.2% | 5.1% |
| Standard Deviation (Sample) | 8.4% | 6.1% |
| Standard Deviation (Population) | 8.3% | 6.1% |
Demographics Similar to Nigerians and Immigrants from Ethiopia by Female Poverty Among 18-24 Year Olds
In terms of female poverty among 18-24 year olds, the demographic groups most similar to Nigerians are Mexican American Indian (20.4%, a difference of 0.010%), Immigrants from Latvia (20.4%, a difference of 0.030%), Immigrants from Israel (20.4%, a difference of 0.070%), Czech (20.4%, a difference of 0.070%), and Moroccan (20.4%, a difference of 0.16%). Similarly, the demographic groups most similar to Immigrants from Ethiopia are Immigrants from Mexico (20.2%, a difference of 0.050%), Nepalese (20.2%, a difference of 0.12%), Immigrants from Central America (20.2%, a difference of 0.14%), Scandinavian (20.3%, a difference of 0.14%), and Lebanese (20.2%, a difference of 0.17%).
| Demographics | Rating | Rank | Female Poverty Among 18-24 Year Olds |
| Ethiopians | 43.8 /100 | #179 | Average 20.2% |
| Iraqis | 43.3 /100 | #180 | Average 20.2% |
| Immigrants | China | 43.0 /100 | #181 | Average 20.2% |
| Immigrants | Barbados | 42.8 /100 | #182 | Average 20.2% |
| Lebanese | 40.6 /100 | #183 | Average 20.2% |
| Immigrants | Central America | 39.9 /100 | #184 | Fair 20.2% |
| Nepalese | 39.7 /100 | #185 | Fair 20.2% |
| Immigrants | Ethiopia | 37.3 /100 | #186 | Fair 20.2% |
| Immigrants | Mexico | 36.3 /100 | #187 | Fair 20.2% |
| Scandinavians | 34.6 /100 | #188 | Fair 20.3% |
| Immigrants | Germany | 34.0 /100 | #189 | Fair 20.3% |
| Immigrants | Western Asia | 29.3 /100 | #190 | Fair 20.3% |
| Moroccans | 25.8 /100 | #191 | Fair 20.4% |
| Immigrants | Israel | 24.4 /100 | #192 | Fair 20.4% |
| Nigerians | 23.4 /100 | #193 | Fair 20.4% |
| Mexican American Indians | 23.2 /100 | #194 | Fair 20.4% |
| Immigrants | Latvia | 23.0 /100 | #195 | Fair 20.4% |
| Czechs | 22.3 /100 | #196 | Fair 20.4% |
| Zimbabweans | 21.0 /100 | #197 | Fair 20.4% |
| Immigrants | Spain | 20.7 /100 | #198 | Fair 20.4% |
| Germans | 20.6 /100 | #199 | Fair 20.4% |