Nigerian vs Senegalese Female Poverty Among 18-24 Year Olds
COMPARE
Nigerian
Senegalese
Female Poverty Among 18-24 Year Olds
Female Poverty Among 18-24 Year Olds Comparison
Nigerians
Senegalese
20.4%
FEMALE POVERTY AMONG 18-24 YEAR OLDS
23.4/ 100
METRIC RATING
193rd/ 347
METRIC RANK
23.0%
FEMALE POVERTY AMONG 18-24 YEAR OLDS
0.0/ 100
METRIC RATING
303rd/ 347
METRIC RANK
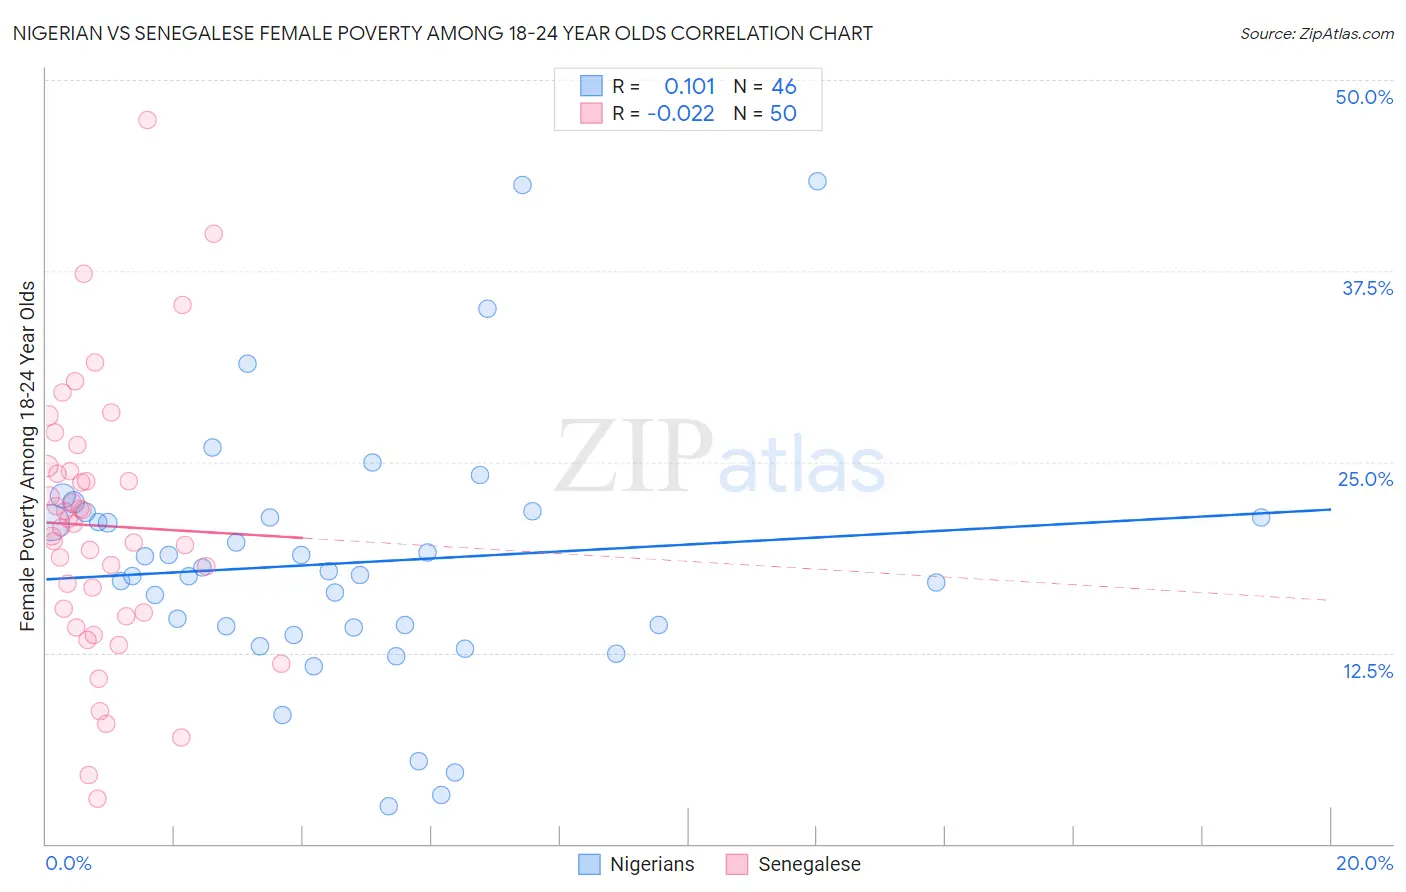
Nigerian vs Senegalese Female Poverty Among 18-24 Year Olds Correlation Chart
The statistical analysis conducted on geographies consisting of 327,876,042 people shows a poor positive correlation between the proportion of Nigerians and poverty level among females between the ages 18 and 24 in the United States with a correlation coefficient (R) of 0.101 and weighted average of 20.4%. Similarly, the statistical analysis conducted on geographies consisting of 77,908,610 people shows no correlation between the proportion of Senegalese and poverty level among females between the ages 18 and 24 in the United States with a correlation coefficient (R) of -0.022 and weighted average of 23.0%, a difference of 12.7%.
Female Poverty Among 18-24 Year Olds Correlation Summary
| Measurement | Nigerian | Senegalese |
| Minimum | 2.5% | 3.0% |
| Maximum | 43.3% | 47.4% |
| Range | 40.9% | 44.4% |
| Mean | 18.4% | 20.8% |
| Median | 17.7% | 20.8% |
| Interquartile 25% (IQ1) | 14.2% | 15.2% |
| Interquartile 75% (IQ3) | 21.4% | 24.4% |
| Interquartile Range (IQR) | 7.2% | 9.2% |
| Standard Deviation (Sample) | 8.4% | 8.7% |
| Standard Deviation (Population) | 8.3% | 8.6% |
Similar Demographics by Female Poverty Among 18-24 Year Olds
Demographics Similar to Nigerians by Female Poverty Among 18-24 Year Olds
In terms of female poverty among 18-24 year olds, the demographic groups most similar to Nigerians are Mexican American Indian (20.4%, a difference of 0.010%), Immigrants from Latvia (20.4%, a difference of 0.030%), Immigrants from Israel (20.4%, a difference of 0.070%), Czech (20.4%, a difference of 0.070%), and Moroccan (20.4%, a difference of 0.16%).
| Demographics | Rating | Rank | Female Poverty Among 18-24 Year Olds |
| Immigrants | Ethiopia | 37.3 /100 | #186 | Fair 20.2% |
| Immigrants | Mexico | 36.3 /100 | #187 | Fair 20.2% |
| Scandinavians | 34.6 /100 | #188 | Fair 20.3% |
| Immigrants | Germany | 34.0 /100 | #189 | Fair 20.3% |
| Immigrants | Western Asia | 29.3 /100 | #190 | Fair 20.3% |
| Moroccans | 25.8 /100 | #191 | Fair 20.4% |
| Immigrants | Israel | 24.4 /100 | #192 | Fair 20.4% |
| Nigerians | 23.4 /100 | #193 | Fair 20.4% |
| Mexican American Indians | 23.2 /100 | #194 | Fair 20.4% |
| Immigrants | Latvia | 23.0 /100 | #195 | Fair 20.4% |
| Czechs | 22.3 /100 | #196 | Fair 20.4% |
| Zimbabweans | 21.0 /100 | #197 | Fair 20.4% |
| Immigrants | Spain | 20.7 /100 | #198 | Fair 20.4% |
| Germans | 20.6 /100 | #199 | Fair 20.4% |
| Europeans | 19.9 /100 | #200 | Poor 20.4% |
Demographics Similar to Senegalese by Female Poverty Among 18-24 Year Olds
In terms of female poverty among 18-24 year olds, the demographic groups most similar to Senegalese are Sudanese (23.0%, a difference of 0.14%), Iroquois (22.9%, a difference of 0.15%), Immigrants from Kuwait (23.0%, a difference of 0.19%), Seminole (22.9%, a difference of 0.54%), and African (22.8%, a difference of 0.63%).
| Demographics | Rating | Rank | Female Poverty Among 18-24 Year Olds |
| Menominee | 0.0 /100 | #296 | Tragic 22.5% |
| Inupiat | 0.0 /100 | #297 | Tragic 22.6% |
| Central American Indians | 0.0 /100 | #298 | Tragic 22.6% |
| Cherokee | 0.0 /100 | #299 | Tragic 22.7% |
| Africans | 0.0 /100 | #300 | Tragic 22.8% |
| Seminole | 0.0 /100 | #301 | Tragic 22.9% |
| Iroquois | 0.0 /100 | #302 | Tragic 22.9% |
| Senegalese | 0.0 /100 | #303 | Tragic 23.0% |
| Sudanese | 0.0 /100 | #304 | Tragic 23.0% |
| Immigrants | Kuwait | 0.0 /100 | #305 | Tragic 23.0% |
| Paiute | 0.0 /100 | #306 | Tragic 23.3% |
| Cree | 0.0 /100 | #307 | Tragic 23.4% |
| Immigrants | Sudan | 0.0 /100 | #308 | Tragic 23.5% |
| Blackfeet | 0.0 /100 | #309 | Tragic 23.6% |
| Comanche | 0.0 /100 | #310 | Tragic 23.6% |