Immigrants from Ecuador vs Immigrants from Ethiopia Female Poverty Among 18-24 Year Olds
COMPARE
Immigrants from Ecuador
Immigrants from Ethiopia
Female Poverty Among 18-24 Year Olds
Female Poverty Among 18-24 Year Olds Comparison
Immigrants from Ecuador
Immigrants from Ethiopia
19.2%
FEMALE POVERTY AMONG 18-24 YEAR OLDS
97.8/ 100
METRIC RATING
105th/ 347
METRIC RANK
20.2%
FEMALE POVERTY AMONG 18-24 YEAR OLDS
37.3/ 100
METRIC RATING
186th/ 347
METRIC RANK
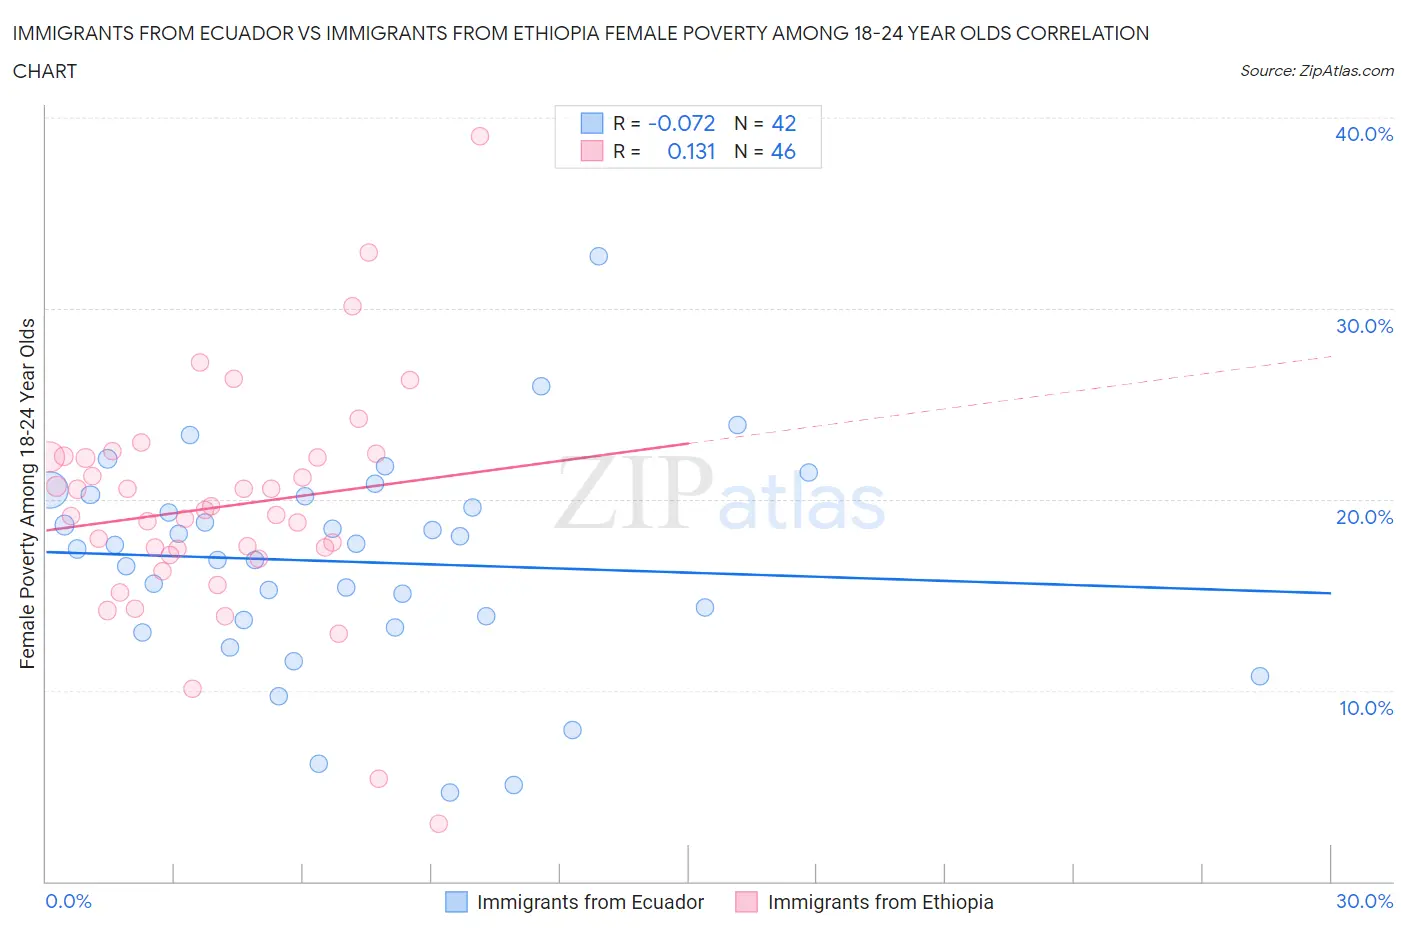
Immigrants from Ecuador vs Immigrants from Ethiopia Female Poverty Among 18-24 Year Olds Correlation Chart
The statistical analysis conducted on geographies consisting of 266,188,241 people shows a slight negative correlation between the proportion of Immigrants from Ecuador and poverty level among females between the ages 18 and 24 in the United States with a correlation coefficient (R) of -0.072 and weighted average of 19.2%. Similarly, the statistical analysis conducted on geographies consisting of 209,579,558 people shows a poor positive correlation between the proportion of Immigrants from Ethiopia and poverty level among females between the ages 18 and 24 in the United States with a correlation coefficient (R) of 0.131 and weighted average of 20.2%, a difference of 5.6%.
Female Poverty Among 18-24 Year Olds Correlation Summary
| Measurement | Immigrants from Ecuador | Immigrants from Ethiopia |
| Minimum | 4.7% | 3.0% |
| Maximum | 32.8% | 39.0% |
| Range | 28.1% | 36.0% |
| Mean | 16.7% | 19.6% |
| Median | 17.5% | 19.3% |
| Interquartile 25% (IQ1) | 13.7% | 17.1% |
| Interquartile 75% (IQ3) | 20.2% | 22.2% |
| Interquartile Range (IQR) | 6.5% | 5.1% |
| Standard Deviation (Sample) | 5.5% | 6.1% |
| Standard Deviation (Population) | 5.5% | 6.1% |
Similar Demographics by Female Poverty Among 18-24 Year Olds
Demographics Similar to Immigrants from Ecuador by Female Poverty Among 18-24 Year Olds
In terms of female poverty among 18-24 year olds, the demographic groups most similar to Immigrants from Ecuador are Immigrants from Sierra Leone (19.2%, a difference of 0.040%), Immigrants from Afghanistan (19.1%, a difference of 0.090%), Serbian (19.1%, a difference of 0.13%), Immigrants from Caribbean (19.1%, a difference of 0.17%), and Ecuadorian (19.1%, a difference of 0.19%).
| Demographics | Rating | Rank | Female Poverty Among 18-24 Year Olds |
| Immigrants | Jordan | 98.4 /100 | #98 | Exceptional 19.1% |
| Immigrants | Czechoslovakia | 98.3 /100 | #99 | Exceptional 19.1% |
| Chileans | 98.3 /100 | #100 | Exceptional 19.1% |
| Ecuadorians | 98.1 /100 | #101 | Exceptional 19.1% |
| Immigrants | Caribbean | 98.1 /100 | #102 | Exceptional 19.1% |
| Serbians | 98.0 /100 | #103 | Exceptional 19.1% |
| Immigrants | Afghanistan | 98.0 /100 | #104 | Exceptional 19.1% |
| Immigrants | Ecuador | 97.8 /100 | #105 | Exceptional 19.2% |
| Immigrants | Sierra Leone | 97.8 /100 | #106 | Exceptional 19.2% |
| Immigrants | Sri Lanka | 97.5 /100 | #107 | Exceptional 19.2% |
| Immigrants | Uzbekistan | 97.3 /100 | #108 | Exceptional 19.2% |
| Immigrants | Syria | 97.2 /100 | #109 | Exceptional 19.2% |
| Laotians | 97.1 /100 | #110 | Exceptional 19.2% |
| Immigrants | Serbia | 97.1 /100 | #111 | Exceptional 19.2% |
| Immigrants | El Salvador | 96.5 /100 | #112 | Exceptional 19.3% |
Demographics Similar to Immigrants from Ethiopia by Female Poverty Among 18-24 Year Olds
In terms of female poverty among 18-24 year olds, the demographic groups most similar to Immigrants from Ethiopia are Immigrants from Mexico (20.2%, a difference of 0.050%), Nepalese (20.2%, a difference of 0.12%), Immigrants from Central America (20.2%, a difference of 0.14%), Scandinavian (20.3%, a difference of 0.14%), and Lebanese (20.2%, a difference of 0.17%).
| Demographics | Rating | Rank | Female Poverty Among 18-24 Year Olds |
| Ethiopians | 43.8 /100 | #179 | Average 20.2% |
| Iraqis | 43.3 /100 | #180 | Average 20.2% |
| Immigrants | China | 43.0 /100 | #181 | Average 20.2% |
| Immigrants | Barbados | 42.8 /100 | #182 | Average 20.2% |
| Lebanese | 40.6 /100 | #183 | Average 20.2% |
| Immigrants | Central America | 39.9 /100 | #184 | Fair 20.2% |
| Nepalese | 39.7 /100 | #185 | Fair 20.2% |
| Immigrants | Ethiopia | 37.3 /100 | #186 | Fair 20.2% |
| Immigrants | Mexico | 36.3 /100 | #187 | Fair 20.2% |
| Scandinavians | 34.6 /100 | #188 | Fair 20.3% |
| Immigrants | Germany | 34.0 /100 | #189 | Fair 20.3% |
| Immigrants | Western Asia | 29.3 /100 | #190 | Fair 20.3% |
| Moroccans | 25.8 /100 | #191 | Fair 20.4% |
| Immigrants | Israel | 24.4 /100 | #192 | Fair 20.4% |
| Nigerians | 23.4 /100 | #193 | Fair 20.4% |