Nigerian vs Immigrants from Caribbean Female Poverty Among 18-24 Year Olds
COMPARE
Nigerian
Immigrants from Caribbean
Female Poverty Among 18-24 Year Olds
Female Poverty Among 18-24 Year Olds Comparison
Nigerians
Immigrants from Caribbean
20.4%
FEMALE POVERTY AMONG 18-24 YEAR OLDS
23.4/ 100
METRIC RATING
193rd/ 347
METRIC RANK
19.1%
FEMALE POVERTY AMONG 18-24 YEAR OLDS
98.1/ 100
METRIC RATING
102nd/ 347
METRIC RANK
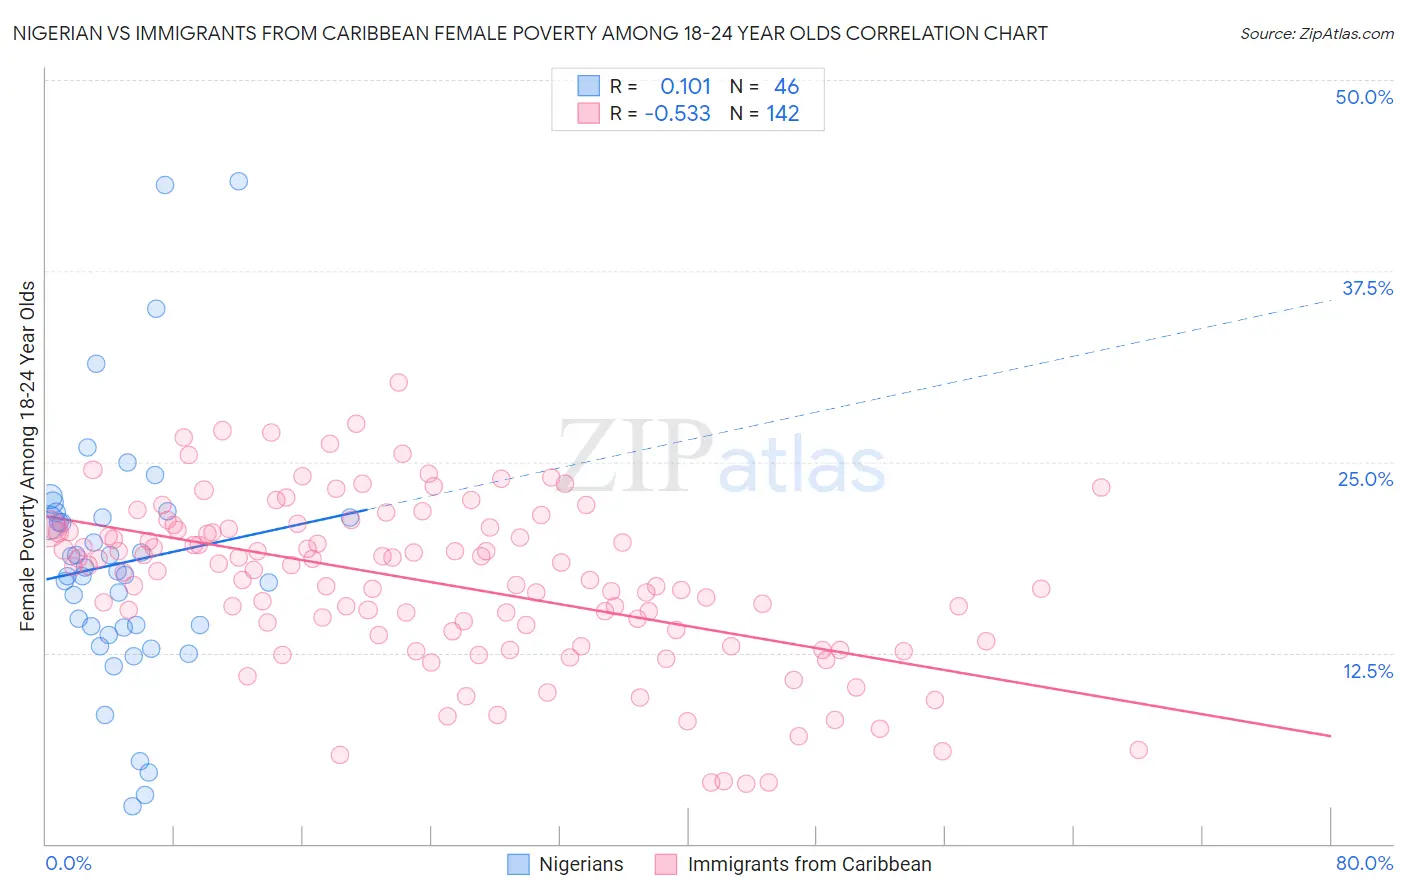
Nigerian vs Immigrants from Caribbean Female Poverty Among 18-24 Year Olds Correlation Chart
The statistical analysis conducted on geographies consisting of 327,876,042 people shows a poor positive correlation between the proportion of Nigerians and poverty level among females between the ages 18 and 24 in the United States with a correlation coefficient (R) of 0.101 and weighted average of 20.4%. Similarly, the statistical analysis conducted on geographies consisting of 436,067,401 people shows a substantial negative correlation between the proportion of Immigrants from Caribbean and poverty level among females between the ages 18 and 24 in the United States with a correlation coefficient (R) of -0.533 and weighted average of 19.1%, a difference of 6.6%.
Female Poverty Among 18-24 Year Olds Correlation Summary
| Measurement | Nigerian | Immigrants from Caribbean |
| Minimum | 2.5% | 4.0% |
| Maximum | 43.3% | 30.2% |
| Range | 40.9% | 26.2% |
| Mean | 18.4% | 17.1% |
| Median | 17.7% | 18.0% |
| Interquartile 25% (IQ1) | 14.2% | 13.9% |
| Interquartile 75% (IQ3) | 21.4% | 20.6% |
| Interquartile Range (IQR) | 7.2% | 6.7% |
| Standard Deviation (Sample) | 8.4% | 5.4% |
| Standard Deviation (Population) | 8.3% | 5.4% |
Similar Demographics by Female Poverty Among 18-24 Year Olds
Demographics Similar to Nigerians by Female Poverty Among 18-24 Year Olds
In terms of female poverty among 18-24 year olds, the demographic groups most similar to Nigerians are Mexican American Indian (20.4%, a difference of 0.010%), Immigrants from Latvia (20.4%, a difference of 0.030%), Immigrants from Israel (20.4%, a difference of 0.070%), Czech (20.4%, a difference of 0.070%), and Moroccan (20.4%, a difference of 0.16%).
| Demographics | Rating | Rank | Female Poverty Among 18-24 Year Olds |
| Immigrants | Ethiopia | 37.3 /100 | #186 | Fair 20.2% |
| Immigrants | Mexico | 36.3 /100 | #187 | Fair 20.2% |
| Scandinavians | 34.6 /100 | #188 | Fair 20.3% |
| Immigrants | Germany | 34.0 /100 | #189 | Fair 20.3% |
| Immigrants | Western Asia | 29.3 /100 | #190 | Fair 20.3% |
| Moroccans | 25.8 /100 | #191 | Fair 20.4% |
| Immigrants | Israel | 24.4 /100 | #192 | Fair 20.4% |
| Nigerians | 23.4 /100 | #193 | Fair 20.4% |
| Mexican American Indians | 23.2 /100 | #194 | Fair 20.4% |
| Immigrants | Latvia | 23.0 /100 | #195 | Fair 20.4% |
| Czechs | 22.3 /100 | #196 | Fair 20.4% |
| Zimbabweans | 21.0 /100 | #197 | Fair 20.4% |
| Immigrants | Spain | 20.7 /100 | #198 | Fair 20.4% |
| Germans | 20.6 /100 | #199 | Fair 20.4% |
| Europeans | 19.9 /100 | #200 | Poor 20.4% |
Demographics Similar to Immigrants from Caribbean by Female Poverty Among 18-24 Year Olds
In terms of female poverty among 18-24 year olds, the demographic groups most similar to Immigrants from Caribbean are Ecuadorian (19.1%, a difference of 0.020%), Serbian (19.1%, a difference of 0.040%), Immigrants from Afghanistan (19.1%, a difference of 0.080%), Chilean (19.1%, a difference of 0.11%), and Immigrants from Czechoslovakia (19.1%, a difference of 0.13%).
| Demographics | Rating | Rank | Female Poverty Among 18-24 Year Olds |
| Guamanians/Chamorros | 98.8 /100 | #95 | Exceptional 19.0% |
| Sierra Leoneans | 98.7 /100 | #96 | Exceptional 19.0% |
| Salvadorans | 98.4 /100 | #97 | Exceptional 19.1% |
| Immigrants | Jordan | 98.4 /100 | #98 | Exceptional 19.1% |
| Immigrants | Czechoslovakia | 98.3 /100 | #99 | Exceptional 19.1% |
| Chileans | 98.3 /100 | #100 | Exceptional 19.1% |
| Ecuadorians | 98.1 /100 | #101 | Exceptional 19.1% |
| Immigrants | Caribbean | 98.1 /100 | #102 | Exceptional 19.1% |
| Serbians | 98.0 /100 | #103 | Exceptional 19.1% |
| Immigrants | Afghanistan | 98.0 /100 | #104 | Exceptional 19.1% |
| Immigrants | Ecuador | 97.8 /100 | #105 | Exceptional 19.2% |
| Immigrants | Sierra Leone | 97.8 /100 | #106 | Exceptional 19.2% |
| Immigrants | Sri Lanka | 97.5 /100 | #107 | Exceptional 19.2% |
| Immigrants | Uzbekistan | 97.3 /100 | #108 | Exceptional 19.2% |
| Immigrants | Syria | 97.2 /100 | #109 | Exceptional 19.2% |