Barbadian vs Immigrants from Ethiopia Female Poverty Among 18-24 Year Olds
COMPARE
Barbadian
Immigrants from Ethiopia
Female Poverty Among 18-24 Year Olds
Female Poverty Among 18-24 Year Olds Comparison
Barbadians
Immigrants from Ethiopia
20.7%
FEMALE POVERTY AMONG 18-24 YEAR OLDS
9.0/ 100
METRIC RATING
221st/ 347
METRIC RANK
20.2%
FEMALE POVERTY AMONG 18-24 YEAR OLDS
37.3/ 100
METRIC RATING
186th/ 347
METRIC RANK
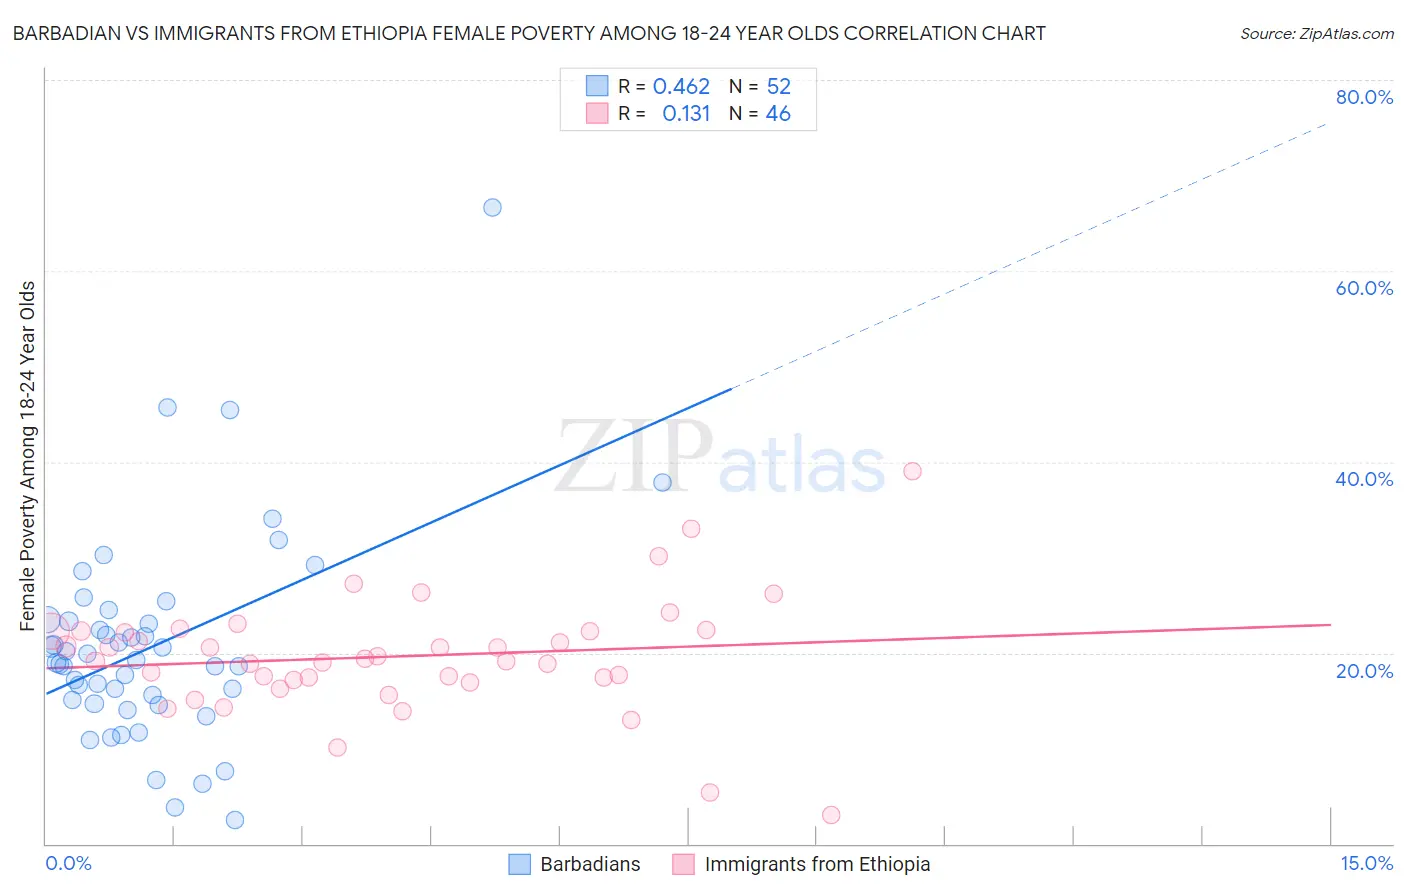
Barbadian vs Immigrants from Ethiopia Female Poverty Among 18-24 Year Olds Correlation Chart
The statistical analysis conducted on geographies consisting of 140,037,273 people shows a moderate positive correlation between the proportion of Barbadians and poverty level among females between the ages 18 and 24 in the United States with a correlation coefficient (R) of 0.462 and weighted average of 20.7%. Similarly, the statistical analysis conducted on geographies consisting of 209,579,558 people shows a poor positive correlation between the proportion of Immigrants from Ethiopia and poverty level among females between the ages 18 and 24 in the United States with a correlation coefficient (R) of 0.131 and weighted average of 20.2%, a difference of 2.2%.
Female Poverty Among 18-24 Year Olds Correlation Summary
| Measurement | Barbadian | Immigrants from Ethiopia |
| Minimum | 2.5% | 3.0% |
| Maximum | 66.7% | 39.0% |
| Range | 64.2% | 36.0% |
| Mean | 20.7% | 19.6% |
| Median | 19.1% | 19.3% |
| Interquartile 25% (IQ1) | 14.9% | 17.1% |
| Interquartile 75% (IQ3) | 23.4% | 22.2% |
| Interquartile Range (IQR) | 8.5% | 5.1% |
| Standard Deviation (Sample) | 11.0% | 6.1% |
| Standard Deviation (Population) | 10.9% | 6.1% |
Similar Demographics by Female Poverty Among 18-24 Year Olds
Demographics Similar to Barbadians by Female Poverty Among 18-24 Year Olds
In terms of female poverty among 18-24 year olds, the demographic groups most similar to Barbadians are British (20.7%, a difference of 0.070%), Immigrants from Micronesia (20.7%, a difference of 0.090%), Immigrants from Nepal (20.7%, a difference of 0.10%), Immigrants from Laos (20.6%, a difference of 0.11%), and Guatemalan (20.7%, a difference of 0.14%).
| Demographics | Rating | Rank | Female Poverty Among 18-24 Year Olds |
| Immigrants | South Africa | 10.7 /100 | #214 | Poor 20.6% |
| Spanish | 10.4 /100 | #215 | Poor 20.6% |
| Immigrants | Western Africa | 10.2 /100 | #216 | Poor 20.6% |
| Immigrants | Laos | 9.7 /100 | #217 | Tragic 20.6% |
| Immigrants | Nepal | 9.6 /100 | #218 | Tragic 20.7% |
| Immigrants | Micronesia | 9.6 /100 | #219 | Tragic 20.7% |
| British | 9.4 /100 | #220 | Tragic 20.7% |
| Barbadians | 9.0 /100 | #221 | Tragic 20.7% |
| Guatemalans | 8.1 /100 | #222 | Tragic 20.7% |
| French | 7.9 /100 | #223 | Tragic 20.7% |
| Immigrants | Liberia | 7.6 /100 | #224 | Tragic 20.7% |
| Norwegians | 7.3 /100 | #225 | Tragic 20.7% |
| Estonians | 7.2 /100 | #226 | Tragic 20.7% |
| Immigrants | Sweden | 6.8 /100 | #227 | Tragic 20.7% |
| Ghanaians | 6.5 /100 | #228 | Tragic 20.8% |
Demographics Similar to Immigrants from Ethiopia by Female Poverty Among 18-24 Year Olds
In terms of female poverty among 18-24 year olds, the demographic groups most similar to Immigrants from Ethiopia are Immigrants from Mexico (20.2%, a difference of 0.050%), Nepalese (20.2%, a difference of 0.12%), Immigrants from Central America (20.2%, a difference of 0.14%), Scandinavian (20.3%, a difference of 0.14%), and Lebanese (20.2%, a difference of 0.17%).
| Demographics | Rating | Rank | Female Poverty Among 18-24 Year Olds |
| Ethiopians | 43.8 /100 | #179 | Average 20.2% |
| Iraqis | 43.3 /100 | #180 | Average 20.2% |
| Immigrants | China | 43.0 /100 | #181 | Average 20.2% |
| Immigrants | Barbados | 42.8 /100 | #182 | Average 20.2% |
| Lebanese | 40.6 /100 | #183 | Average 20.2% |
| Immigrants | Central America | 39.9 /100 | #184 | Fair 20.2% |
| Nepalese | 39.7 /100 | #185 | Fair 20.2% |
| Immigrants | Ethiopia | 37.3 /100 | #186 | Fair 20.2% |
| Immigrants | Mexico | 36.3 /100 | #187 | Fair 20.2% |
| Scandinavians | 34.6 /100 | #188 | Fair 20.3% |
| Immigrants | Germany | 34.0 /100 | #189 | Fair 20.3% |
| Immigrants | Western Asia | 29.3 /100 | #190 | Fair 20.3% |
| Moroccans | 25.8 /100 | #191 | Fair 20.4% |
| Immigrants | Israel | 24.4 /100 | #192 | Fair 20.4% |
| Nigerians | 23.4 /100 | #193 | Fair 20.4% |