Nicaraguan vs Pima Seniors Poverty Over the Age of 75
COMPARE
Nicaraguan
Pima
Seniors Poverty Over the Age of 75
Seniors Poverty Over the Age of 75 Comparison
Nicaraguans
Pima
16.6%
SENIORS POVERTY OVER THE AGE OF 75
0.0/ 100
METRIC RATING
325th/ 347
METRIC RANK
23.9%
SENIORS POVERTY OVER THE AGE OF 75
0.0/ 100
METRIC RATING
347th/ 347
METRIC RANK
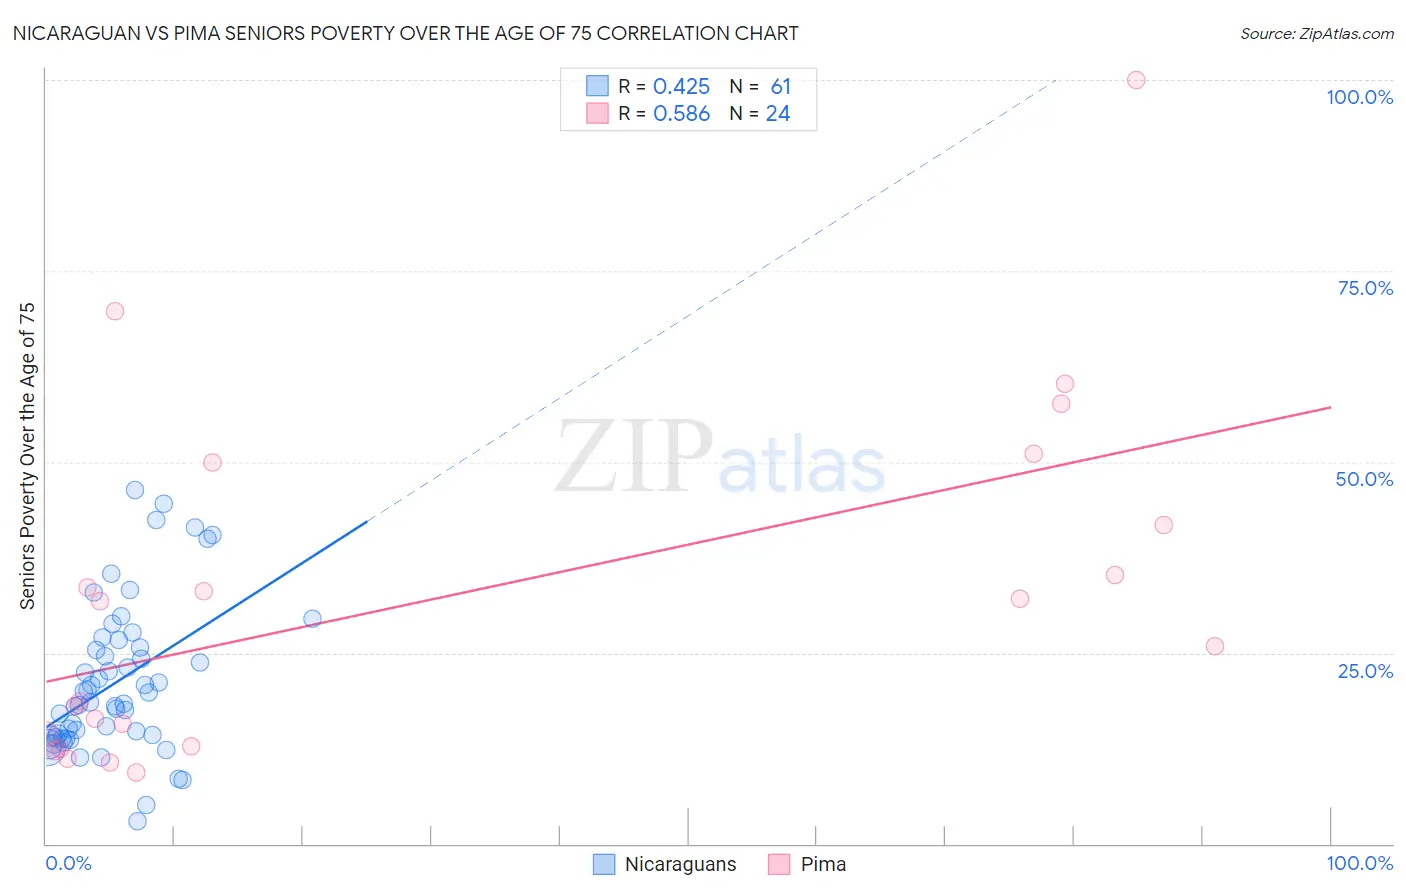
Nicaraguan vs Pima Seniors Poverty Over the Age of 75 Correlation Chart
The statistical analysis conducted on geographies consisting of 283,995,747 people shows a moderate positive correlation between the proportion of Nicaraguans and poverty level among seniors over the age of 75 in the United States with a correlation coefficient (R) of 0.425 and weighted average of 16.6%. Similarly, the statistical analysis conducted on geographies consisting of 61,445,536 people shows a substantial positive correlation between the proportion of Pima and poverty level among seniors over the age of 75 in the United States with a correlation coefficient (R) of 0.586 and weighted average of 23.9%, a difference of 43.8%.
Seniors Poverty Over the Age of 75 Correlation Summary
| Measurement | Nicaraguan | Pima |
| Minimum | 2.9% | 9.4% |
| Maximum | 46.3% | 100.0% |
| Range | 43.4% | 90.6% |
| Mean | 21.1% | 32.2% |
| Median | 18.4% | 28.8% |
| Interquartile 25% (IQ1) | 14.0% | 13.6% |
| Interquartile 75% (IQ3) | 26.2% | 45.8% |
| Interquartile Range (IQR) | 12.2% | 32.3% |
| Standard Deviation (Sample) | 9.8% | 22.9% |
| Standard Deviation (Population) | 9.7% | 22.4% |
Similar Demographics by Seniors Poverty Over the Age of 75
Demographics Similar to Nicaraguans by Seniors Poverty Over the Age of 75
In terms of seniors poverty over the age of 75, the demographic groups most similar to Nicaraguans are Immigrants from Uzbekistan (16.5%, a difference of 0.38%), Central American Indian (16.5%, a difference of 0.43%), Immigrants from Barbados (16.5%, a difference of 0.52%), Immigrants from Haiti (16.5%, a difference of 0.55%), and Pueblo (16.7%, a difference of 0.70%).
| Demographics | Rating | Rank | Seniors Poverty Over the Age of 75 |
| Houma | 0.0 /100 | #318 | Tragic 16.2% |
| Haitians | 0.0 /100 | #319 | Tragic 16.2% |
| Immigrants | Yemen | 0.0 /100 | #320 | Tragic 16.5% |
| Immigrants | Haiti | 0.0 /100 | #321 | Tragic 16.5% |
| Immigrants | Barbados | 0.0 /100 | #322 | Tragic 16.5% |
| Central American Indians | 0.0 /100 | #323 | Tragic 16.5% |
| Immigrants | Uzbekistan | 0.0 /100 | #324 | Tragic 16.5% |
| Nicaraguans | 0.0 /100 | #325 | Tragic 16.6% |
| Pueblo | 0.0 /100 | #326 | Tragic 16.7% |
| Sioux | 0.0 /100 | #327 | Tragic 16.8% |
| Cape Verdeans | 0.0 /100 | #328 | Tragic 16.8% |
| Immigrants | Dominica | 0.0 /100 | #329 | Tragic 17.0% |
| British West Indians | 0.0 /100 | #330 | Tragic 17.4% |
| Immigrants | Armenia | 0.0 /100 | #331 | Tragic 17.5% |
| Immigrants | St. Vincent and the Grenadines | 0.0 /100 | #332 | Tragic 17.5% |
Demographics Similar to Pima by Seniors Poverty Over the Age of 75
In terms of seniors poverty over the age of 75, the demographic groups most similar to Pima are Puerto Rican (23.2%, a difference of 2.9%), Immigrants from Dominican Republic (20.1%, a difference of 19.1%), Immigrants from Cuba (19.9%, a difference of 20.0%), Lumbee (19.7%, a difference of 20.9%), and Dominican (19.6%, a difference of 21.7%).
| Demographics | Rating | Rank | Seniors Poverty Over the Age of 75 |
| Immigrants | Nicaragua | 0.0 /100 | #333 | Tragic 17.6% |
| Immigrants | Grenada | 0.0 /100 | #334 | Tragic 17.8% |
| Cubans | 0.0 /100 | #335 | Tragic 18.0% |
| Immigrants | Caribbean | 0.0 /100 | #336 | Tragic 18.2% |
| Yakama | 0.0 /100 | #337 | Tragic 18.3% |
| Immigrants | Cabo Verde | 0.0 /100 | #338 | Tragic 18.5% |
| Hopi | 0.0 /100 | #339 | Tragic 18.9% |
| Tohono O'odham | 0.0 /100 | #340 | Tragic 19.1% |
| Navajo | 0.0 /100 | #341 | Tragic 19.4% |
| Dominicans | 0.0 /100 | #342 | Tragic 19.6% |
| Lumbee | 0.0 /100 | #343 | Tragic 19.7% |
| Immigrants | Cuba | 0.0 /100 | #344 | Tragic 19.9% |
| Immigrants | Dominican Republic | 0.0 /100 | #345 | Tragic 20.1% |
| Puerto Ricans | 0.0 /100 | #346 | Tragic 23.2% |
| Pima | 0.0 /100 | #347 | Tragic 23.9% |