Nicaraguan vs Pima 5th Grade
COMPARE
Nicaraguan
Pima
5th Grade
5th Grade Comparison
Nicaraguans
Pima
95.9%
5TH GRADE
0.0/ 100
METRIC RATING
315th/ 347
METRIC RANK
97.6%
5TH GRADE
91.2/ 100
METRIC RATING
131st/ 347
METRIC RANK
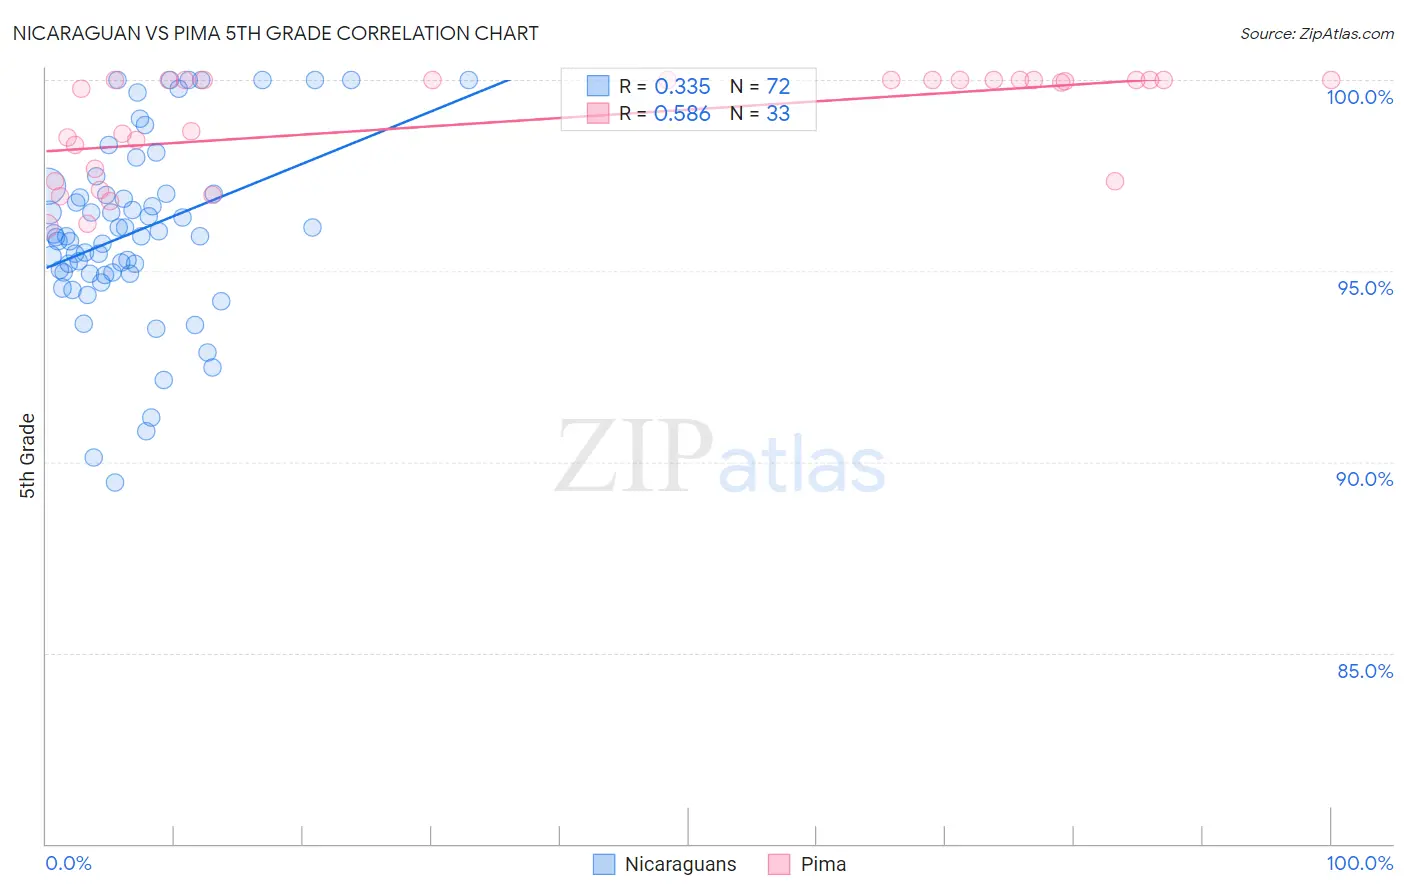
Nicaraguan vs Pima 5th Grade Correlation Chart
The statistical analysis conducted on geographies consisting of 285,711,389 people shows a mild positive correlation between the proportion of Nicaraguans and percentage of population with at least 5th grade education in the United States with a correlation coefficient (R) of 0.335 and weighted average of 95.9%. Similarly, the statistical analysis conducted on geographies consisting of 61,552,136 people shows a substantial positive correlation between the proportion of Pima and percentage of population with at least 5th grade education in the United States with a correlation coefficient (R) of 0.586 and weighted average of 97.6%, a difference of 1.8%.
5th Grade Correlation Summary
| Measurement | Nicaraguan | Pima |
| Minimum | 89.5% | 96.2% |
| Maximum | 100.0% | 100.0% |
| Range | 10.5% | 3.8% |
| Mean | 96.0% | 98.9% |
| Median | 95.9% | 100.0% |
| Interquartile 25% (IQ1) | 94.9% | 97.5% |
| Interquartile 75% (IQ3) | 97.0% | 100.0% |
| Interquartile Range (IQR) | 2.1% | 2.5% |
| Standard Deviation (Sample) | 2.4% | 1.4% |
| Standard Deviation (Population) | 2.4% | 1.3% |
Similar Demographics by 5th Grade
Demographics Similar to Nicaraguans by 5th Grade
In terms of 5th grade, the demographic groups most similar to Nicaraguans are Bangladeshi (95.9%, a difference of 0.020%), Immigrants from Portugal (95.9%, a difference of 0.020%), Vietnamese (95.9%, a difference of 0.040%), Immigrants from Ecuador (95.8%, a difference of 0.060%), and Immigrants from Bangladesh (96.0%, a difference of 0.070%).
| Demographics | Rating | Rank | 5th Grade |
| Ecuadorians | 0.0 /100 | #308 | Tragic 96.0% |
| Immigrants | Guyana | 0.0 /100 | #309 | Tragic 96.0% |
| Indonesians | 0.0 /100 | #310 | Tragic 96.0% |
| Immigrants | Bangladesh | 0.0 /100 | #311 | Tragic 96.0% |
| Vietnamese | 0.0 /100 | #312 | Tragic 95.9% |
| Bangladeshis | 0.0 /100 | #313 | Tragic 95.9% |
| Immigrants | Portugal | 0.0 /100 | #314 | Tragic 95.9% |
| Nicaraguans | 0.0 /100 | #315 | Tragic 95.9% |
| Immigrants | Ecuador | 0.0 /100 | #316 | Tragic 95.8% |
| Belizeans | 0.0 /100 | #317 | Tragic 95.8% |
| Immigrants | Vietnam | 0.0 /100 | #318 | Tragic 95.8% |
| Japanese | 0.0 /100 | #319 | Tragic 95.7% |
| Central American Indians | 0.0 /100 | #320 | Tragic 95.7% |
| Immigrants | Belize | 0.0 /100 | #321 | Tragic 95.7% |
| Immigrants | Nicaragua | 0.0 /100 | #322 | Tragic 95.6% |
Demographics Similar to Pima by 5th Grade
In terms of 5th grade, the demographic groups most similar to Pima are Immigrants from Serbia (97.6%, a difference of 0.010%), Colville (97.6%, a difference of 0.010%), Immigrants from Europe (97.6%, a difference of 0.010%), Immigrants from Romania (97.6%, a difference of 0.010%), and Immigrants from Kuwait (97.6%, a difference of 0.010%).
| Demographics | Rating | Rank | 5th Grade |
| Spanish | 93.7 /100 | #124 | Exceptional 97.6% |
| Immigrants | Bulgaria | 93.1 /100 | #125 | Exceptional 97.6% |
| Hmong | 92.3 /100 | #126 | Exceptional 97.6% |
| Immigrants | Serbia | 92.3 /100 | #127 | Exceptional 97.6% |
| Colville | 92.0 /100 | #128 | Exceptional 97.6% |
| Immigrants | Europe | 91.9 /100 | #129 | Exceptional 97.6% |
| Immigrants | Romania | 91.6 /100 | #130 | Exceptional 97.6% |
| Pima | 91.2 /100 | #131 | Exceptional 97.6% |
| Immigrants | Kuwait | 90.4 /100 | #132 | Exceptional 97.6% |
| Cambodians | 90.2 /100 | #133 | Exceptional 97.6% |
| Immigrants | Hungary | 90.1 /100 | #134 | Exceptional 97.6% |
| Palestinians | 89.3 /100 | #135 | Excellent 97.5% |
| Immigrants | Moldova | 87.5 /100 | #136 | Excellent 97.5% |
| Filipinos | 86.8 /100 | #137 | Excellent 97.5% |
| Blackfeet | 86.8 /100 | #138 | Excellent 97.5% |