Immigrants from Spain vs Pima Seniors Poverty Over the Age of 75
COMPARE
Immigrants from Spain
Pima
Seniors Poverty Over the Age of 75
Seniors Poverty Over the Age of 75 Comparison
Immigrants from Spain
Pima
13.7%
SENIORS POVERTY OVER THE AGE OF 75
0.2/ 100
METRIC RATING
253rd/ 347
METRIC RANK
23.9%
SENIORS POVERTY OVER THE AGE OF 75
0.0/ 100
METRIC RATING
347th/ 347
METRIC RANK
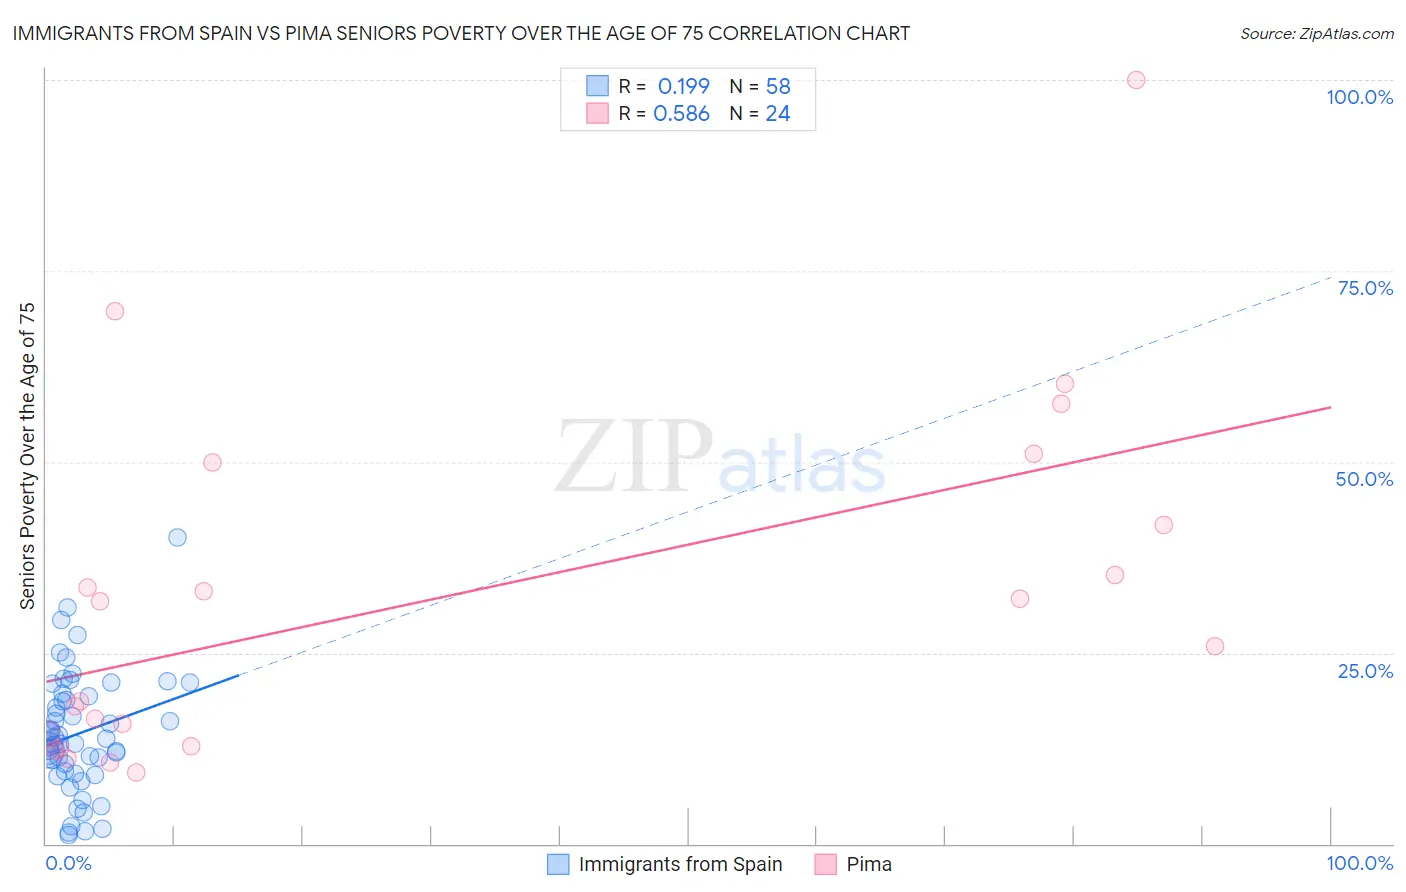
Immigrants from Spain vs Pima Seniors Poverty Over the Age of 75 Correlation Chart
The statistical analysis conducted on geographies consisting of 238,304,495 people shows a poor positive correlation between the proportion of Immigrants from Spain and poverty level among seniors over the age of 75 in the United States with a correlation coefficient (R) of 0.199 and weighted average of 13.7%. Similarly, the statistical analysis conducted on geographies consisting of 61,445,536 people shows a substantial positive correlation between the proportion of Pima and poverty level among seniors over the age of 75 in the United States with a correlation coefficient (R) of 0.586 and weighted average of 23.9%, a difference of 74.4%.
Seniors Poverty Over the Age of 75 Correlation Summary
| Measurement | Immigrants from Spain | Pima |
| Minimum | 1.1% | 9.4% |
| Maximum | 40.1% | 100.0% |
| Range | 39.0% | 90.6% |
| Mean | 14.4% | 32.2% |
| Median | 13.5% | 28.8% |
| Interquartile 25% (IQ1) | 9.4% | 13.6% |
| Interquartile 75% (IQ3) | 19.3% | 45.8% |
| Interquartile Range (IQR) | 9.8% | 32.3% |
| Standard Deviation (Sample) | 7.8% | 22.9% |
| Standard Deviation (Population) | 7.7% | 22.4% |
Similar Demographics by Seniors Poverty Over the Age of 75
Demographics Similar to Immigrants from Spain by Seniors Poverty Over the Age of 75
In terms of seniors poverty over the age of 75, the demographic groups most similar to Immigrants from Spain are Blackfeet (13.7%, a difference of 0.11%), Immigrants from Argentina (13.7%, a difference of 0.22%), Immigrants from Peru (13.7%, a difference of 0.27%), Immigrants from Belarus (13.8%, a difference of 0.54%), and Mexican American Indian (13.6%, a difference of 0.60%).
| Demographics | Rating | Rank | Seniors Poverty Over the Age of 75 |
| Immigrants | Cambodia | 0.4 /100 | #246 | Tragic 13.6% |
| Immigrants | Ukraine | 0.3 /100 | #247 | Tragic 13.6% |
| Africans | 0.3 /100 | #248 | Tragic 13.6% |
| Immigrants | Albania | 0.3 /100 | #249 | Tragic 13.6% |
| Mexican American Indians | 0.3 /100 | #250 | Tragic 13.6% |
| Immigrants | Peru | 0.3 /100 | #251 | Tragic 13.7% |
| Immigrants | Argentina | 0.3 /100 | #252 | Tragic 13.7% |
| Immigrants | Spain | 0.2 /100 | #253 | Tragic 13.7% |
| Blackfeet | 0.2 /100 | #254 | Tragic 13.7% |
| Immigrants | Belarus | 0.2 /100 | #255 | Tragic 13.8% |
| Inupiat | 0.1 /100 | #256 | Tragic 13.8% |
| Immigrants | Western Africa | 0.1 /100 | #257 | Tragic 13.9% |
| Immigrants | Panama | 0.1 /100 | #258 | Tragic 13.9% |
| Immigrants | Portugal | 0.1 /100 | #259 | Tragic 13.9% |
| Immigrants | Immigrants | 0.1 /100 | #260 | Tragic 13.9% |
Demographics Similar to Pima by Seniors Poverty Over the Age of 75
In terms of seniors poverty over the age of 75, the demographic groups most similar to Pima are Puerto Rican (23.2%, a difference of 2.9%), Immigrants from Dominican Republic (20.1%, a difference of 19.1%), Immigrants from Cuba (19.9%, a difference of 20.0%), Lumbee (19.7%, a difference of 20.9%), and Dominican (19.6%, a difference of 21.7%).
| Demographics | Rating | Rank | Seniors Poverty Over the Age of 75 |
| Immigrants | Nicaragua | 0.0 /100 | #333 | Tragic 17.6% |
| Immigrants | Grenada | 0.0 /100 | #334 | Tragic 17.8% |
| Cubans | 0.0 /100 | #335 | Tragic 18.0% |
| Immigrants | Caribbean | 0.0 /100 | #336 | Tragic 18.2% |
| Yakama | 0.0 /100 | #337 | Tragic 18.3% |
| Immigrants | Cabo Verde | 0.0 /100 | #338 | Tragic 18.5% |
| Hopi | 0.0 /100 | #339 | Tragic 18.9% |
| Tohono O'odham | 0.0 /100 | #340 | Tragic 19.1% |
| Navajo | 0.0 /100 | #341 | Tragic 19.4% |
| Dominicans | 0.0 /100 | #342 | Tragic 19.6% |
| Lumbee | 0.0 /100 | #343 | Tragic 19.7% |
| Immigrants | Cuba | 0.0 /100 | #344 | Tragic 19.9% |
| Immigrants | Dominican Republic | 0.0 /100 | #345 | Tragic 20.1% |
| Puerto Ricans | 0.0 /100 | #346 | Tragic 23.2% |
| Pima | 0.0 /100 | #347 | Tragic 23.9% |