Nicaraguan vs Immigrants from Western Asia Child Poverty Among Boys Under 16
COMPARE
Nicaraguan
Immigrants from Western Asia
Child Poverty Among Boys Under 16
Child Poverty Among Boys Under 16 Comparison
Nicaraguans
Immigrants from Western Asia
18.4%
CHILD POVERTY AMONG BOYS UNDER 16
1.4/ 100
METRIC RATING
231st/ 347
METRIC RANK
16.6%
CHILD POVERTY AMONG BOYS UNDER 16
40.4/ 100
METRIC RATING
185th/ 347
METRIC RANK
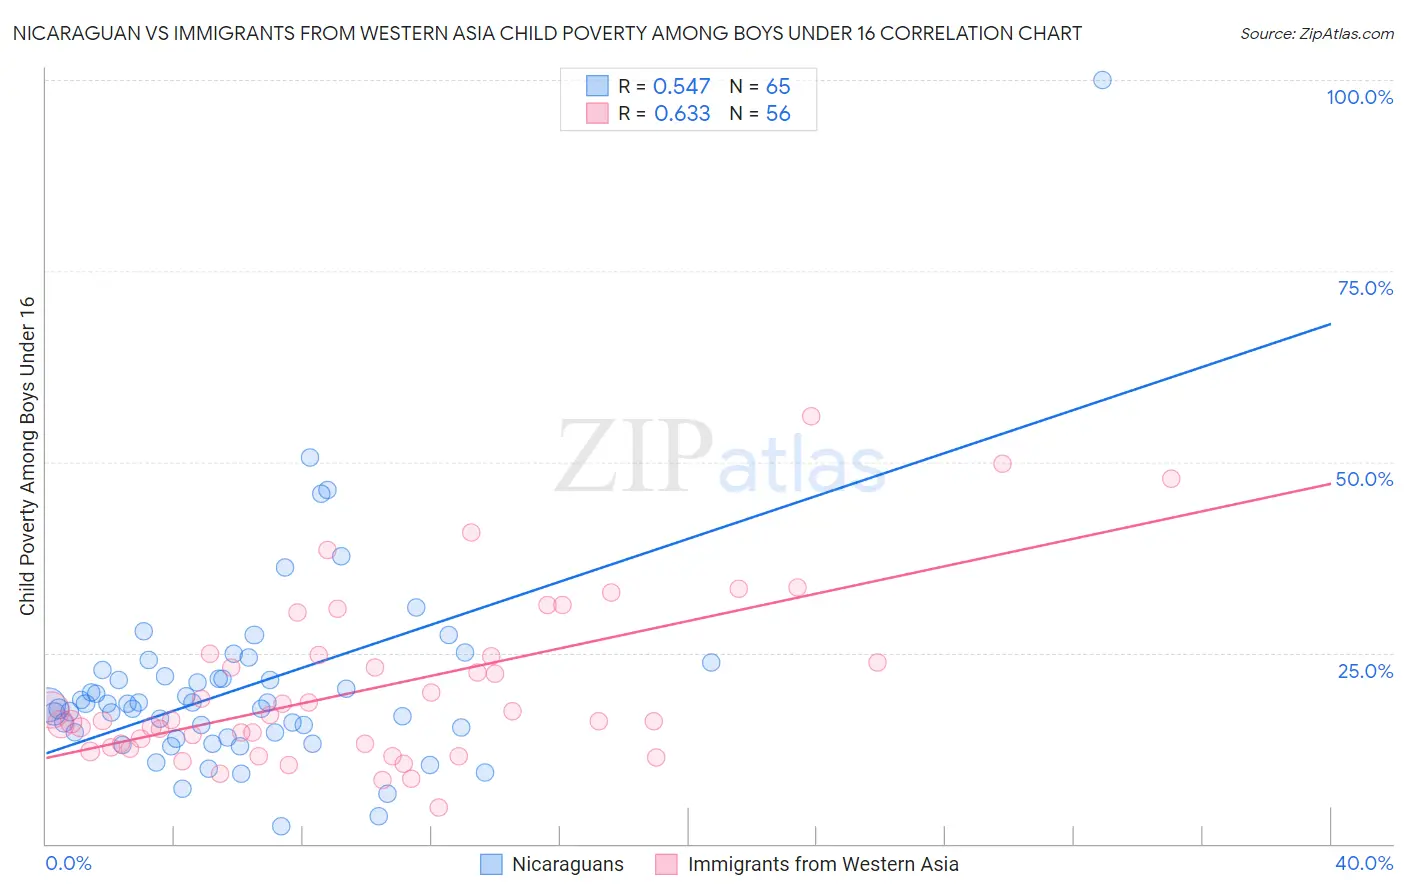
Nicaraguan vs Immigrants from Western Asia Child Poverty Among Boys Under 16 Correlation Chart
The statistical analysis conducted on geographies consisting of 283,666,895 people shows a substantial positive correlation between the proportion of Nicaraguans and poverty level among boys under the age of 16 in the United States with a correlation coefficient (R) of 0.547 and weighted average of 18.4%. Similarly, the statistical analysis conducted on geographies consisting of 396,864,941 people shows a significant positive correlation between the proportion of Immigrants from Western Asia and poverty level among boys under the age of 16 in the United States with a correlation coefficient (R) of 0.633 and weighted average of 16.6%, a difference of 10.6%.
Child Poverty Among Boys Under 16 Correlation Summary
| Measurement | Nicaraguan | Immigrants from Western Asia |
| Minimum | 2.3% | 4.7% |
| Maximum | 100.0% | 55.9% |
| Range | 97.7% | 51.2% |
| Mean | 20.6% | 20.4% |
| Median | 18.3% | 16.2% |
| Interquartile 25% (IQ1) | 14.3% | 12.8% |
| Interquartile 75% (IQ3) | 22.4% | 24.7% |
| Interquartile Range (IQR) | 8.1% | 11.9% |
| Standard Deviation (Sample) | 13.5% | 10.9% |
| Standard Deviation (Population) | 13.4% | 10.9% |
Similar Demographics by Child Poverty Among Boys Under 16
Demographics Similar to Nicaraguans by Child Poverty Among Boys Under 16
In terms of child poverty among boys under 16, the demographic groups most similar to Nicaraguans are Marshallese (18.4%, a difference of 0.20%), Immigrants from Nigeria (18.4%, a difference of 0.39%), Immigrants from Micronesia (18.3%, a difference of 0.53%), Fijian (18.3%, a difference of 0.53%), and Nigerian (18.5%, a difference of 0.64%).
| Demographics | Rating | Rank | Child Poverty Among Boys Under 16 |
| Nepalese | 3.2 /100 | #224 | Tragic 18.0% |
| Inupiat | 2.7 /100 | #225 | Tragic 18.1% |
| Immigrants | Africa | 2.6 /100 | #226 | Tragic 18.1% |
| Bermudans | 2.5 /100 | #227 | Tragic 18.1% |
| Immigrants | Nonimmigrants | 2.2 /100 | #228 | Tragic 18.2% |
| Immigrants | Micronesia | 1.8 /100 | #229 | Tragic 18.3% |
| Fijians | 1.8 /100 | #230 | Tragic 18.3% |
| Nicaraguans | 1.4 /100 | #231 | Tragic 18.4% |
| Marshallese | 1.3 /100 | #232 | Tragic 18.4% |
| Immigrants | Nigeria | 1.2 /100 | #233 | Tragic 18.4% |
| Nigerians | 1.1 /100 | #234 | Tragic 18.5% |
| Americans | 0.9 /100 | #235 | Tragic 18.6% |
| Sudanese | 0.9 /100 | #236 | Tragic 18.6% |
| Immigrants | Eritrea | 0.8 /100 | #237 | Tragic 18.6% |
| Immigrants | Laos | 0.8 /100 | #238 | Tragic 18.7% |
Demographics Similar to Immigrants from Western Asia by Child Poverty Among Boys Under 16
In terms of child poverty among boys under 16, the demographic groups most similar to Immigrants from Western Asia are Celtic (16.6%, a difference of 0.030%), Kenyan (16.6%, a difference of 0.070%), Hmong (16.6%, a difference of 0.22%), Immigrants from Costa Rica (16.7%, a difference of 0.30%), and Immigrants from South America (16.7%, a difference of 0.31%).
| Demographics | Rating | Rank | Child Poverty Among Boys Under 16 |
| Scotch-Irish | 47.5 /100 | #178 | Average 16.5% |
| Hungarians | 47.3 /100 | #179 | Average 16.5% |
| Hawaiians | 45.5 /100 | #180 | Average 16.5% |
| South American Indians | 44.3 /100 | #181 | Average 16.5% |
| Lebanese | 43.3 /100 | #182 | Average 16.6% |
| Kenyans | 41.0 /100 | #183 | Average 16.6% |
| Celtics | 40.6 /100 | #184 | Average 16.6% |
| Immigrants | Western Asia | 40.4 /100 | #185 | Average 16.6% |
| Hmong | 38.4 /100 | #186 | Fair 16.6% |
| Immigrants | Costa Rica | 37.8 /100 | #187 | Fair 16.7% |
| Immigrants | South America | 37.7 /100 | #188 | Fair 16.7% |
| Immigrants | Morocco | 34.5 /100 | #189 | Fair 16.7% |
| Arabs | 31.1 /100 | #190 | Fair 16.8% |
| Alaska Natives | 29.8 /100 | #191 | Fair 16.8% |
| Immigrants | Uganda | 21.6 /100 | #192 | Fair 17.0% |