Nicaraguan vs Immigrants from Moldova Child Poverty Under the Age of 5
COMPARE
Nicaraguan
Immigrants from Moldova
Child Poverty Under the Age of 5
Child Poverty Under the Age of 5 Comparison
Nicaraguans
Immigrants from Moldova
19.1%
CHILD POVERTY UNDER THE AGE OF 5
1.6/ 100
METRIC RATING
224th/ 347
METRIC RANK
14.5%
CHILD POVERTY UNDER THE AGE OF 5
99.8/ 100
METRIC RATING
34th/ 347
METRIC RANK
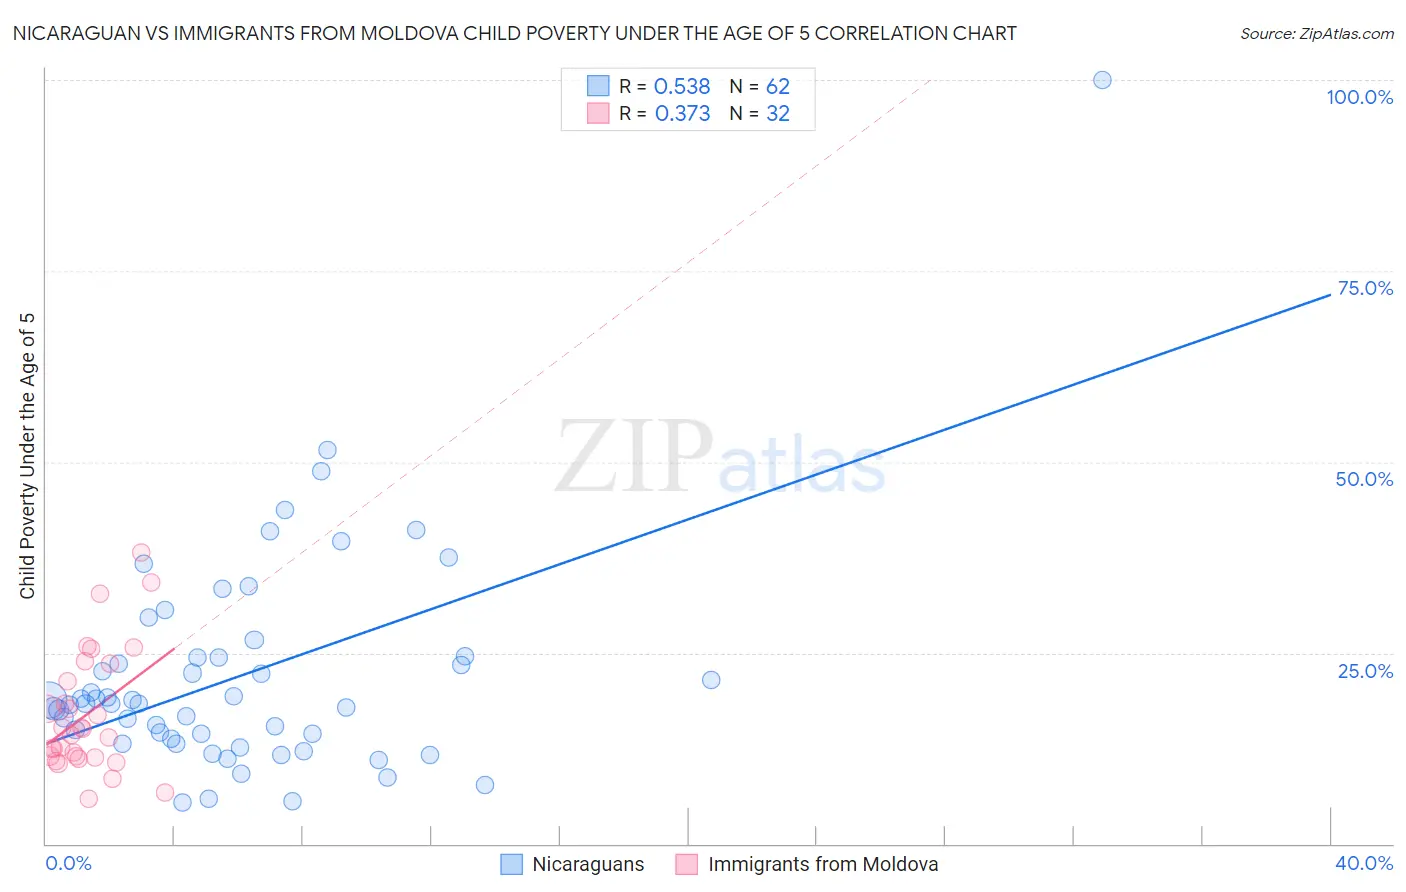
Nicaraguan vs Immigrants from Moldova Child Poverty Under the Age of 5 Correlation Chart
The statistical analysis conducted on geographies consisting of 279,523,506 people shows a substantial positive correlation between the proportion of Nicaraguans and poverty level among children under the age of 5 in the United States with a correlation coefficient (R) of 0.538 and weighted average of 19.1%. Similarly, the statistical analysis conducted on geographies consisting of 121,099,285 people shows a mild positive correlation between the proportion of Immigrants from Moldova and poverty level among children under the age of 5 in the United States with a correlation coefficient (R) of 0.373 and weighted average of 14.5%, a difference of 31.6%.
Child Poverty Under the Age of 5 Correlation Summary
| Measurement | Nicaraguan | Immigrants from Moldova |
| Minimum | 5.4% | 6.0% |
| Maximum | 100.0% | 38.1% |
| Range | 94.6% | 32.1% |
| Mean | 22.0% | 17.0% |
| Median | 18.4% | 14.7% |
| Interquartile 25% (IQ1) | 13.8% | 11.4% |
| Interquartile 75% (IQ3) | 24.4% | 22.4% |
| Interquartile Range (IQR) | 10.7% | 11.0% |
| Standard Deviation (Sample) | 14.6% | 8.0% |
| Standard Deviation (Population) | 14.5% | 7.9% |
Similar Demographics by Child Poverty Under the Age of 5
Demographics Similar to Nicaraguans by Child Poverty Under the Age of 5
In terms of child poverty under the age of 5, the demographic groups most similar to Nicaraguans are Nigerian (19.1%, a difference of 0.030%), Immigrants from Eritrea (19.1%, a difference of 0.050%), Cuban (19.1%, a difference of 0.11%), Alsatian (19.1%, a difference of 0.13%), and Cape Verdean (19.1%, a difference of 0.23%).
| Demographics | Rating | Rank | Child Poverty Under the Age of 5 |
| Immigrants | Africa | 4.6 /100 | #217 | Tragic 18.6% |
| Delaware | 3.4 /100 | #218 | Tragic 18.7% |
| German Russians | 3.0 /100 | #219 | Tragic 18.8% |
| Immigrants | Azores | 2.6 /100 | #220 | Tragic 18.9% |
| Immigrants | Nigeria | 2.1 /100 | #221 | Tragic 19.0% |
| Alsatians | 1.7 /100 | #222 | Tragic 19.1% |
| Cubans | 1.7 /100 | #223 | Tragic 19.1% |
| Nicaraguans | 1.6 /100 | #224 | Tragic 19.1% |
| Nigerians | 1.6 /100 | #225 | Tragic 19.1% |
| Immigrants | Eritrea | 1.5 /100 | #226 | Tragic 19.1% |
| Cape Verdeans | 1.4 /100 | #227 | Tragic 19.1% |
| Immigrants | Sudan | 1.3 /100 | #228 | Tragic 19.2% |
| Ghanaians | 1.2 /100 | #229 | Tragic 19.2% |
| Ecuadorians | 1.2 /100 | #230 | Tragic 19.2% |
| Bermudans | 1.2 /100 | #231 | Tragic 19.2% |
Demographics Similar to Immigrants from Moldova by Child Poverty Under the Age of 5
In terms of child poverty under the age of 5, the demographic groups most similar to Immigrants from Moldova are Latvian (14.5%, a difference of 0.010%), Maltese (14.5%, a difference of 0.080%), Taiwanese (14.5%, a difference of 0.10%), Immigrants from Sri Lanka (14.4%, a difference of 0.40%), and Turkish (14.6%, a difference of 0.42%).
| Demographics | Rating | Rank | Child Poverty Under the Age of 5 |
| Tongans | 99.9 /100 | #27 | Exceptional 14.2% |
| Immigrants | Indonesia | 99.8 /100 | #28 | Exceptional 14.3% |
| Immigrants | Asia | 99.8 /100 | #29 | Exceptional 14.4% |
| Cambodians | 99.8 /100 | #30 | Exceptional 14.4% |
| Koreans | 99.8 /100 | #31 | Exceptional 14.4% |
| Immigrants | Sri Lanka | 99.8 /100 | #32 | Exceptional 14.4% |
| Taiwanese | 99.8 /100 | #33 | Exceptional 14.5% |
| Immigrants | Moldova | 99.8 /100 | #34 | Exceptional 14.5% |
| Latvians | 99.8 /100 | #35 | Exceptional 14.5% |
| Maltese | 99.8 /100 | #36 | Exceptional 14.5% |
| Turks | 99.7 /100 | #37 | Exceptional 14.6% |
| Eastern Europeans | 99.7 /100 | #38 | Exceptional 14.6% |
| Norwegians | 99.7 /100 | #39 | Exceptional 14.6% |
| Immigrants | Australia | 99.7 /100 | #40 | Exceptional 14.6% |
| Immigrants | Belarus | 99.7 /100 | #41 | Exceptional 14.7% |