Immigrants from North Macedonia vs Belizean Child Poverty Among Boys Under 16
COMPARE
Immigrants from North Macedonia
Belizean
Child Poverty Among Boys Under 16
Child Poverty Among Boys Under 16 Comparison
Immigrants from North Macedonia
Belizeans
14.9%
CHILD POVERTY AMONG BOYS UNDER 16
96.3/ 100
METRIC RATING
96th/ 347
METRIC RANK
19.9%
CHILD POVERTY AMONG BOYS UNDER 16
0.1/ 100
METRIC RATING
273rd/ 347
METRIC RANK
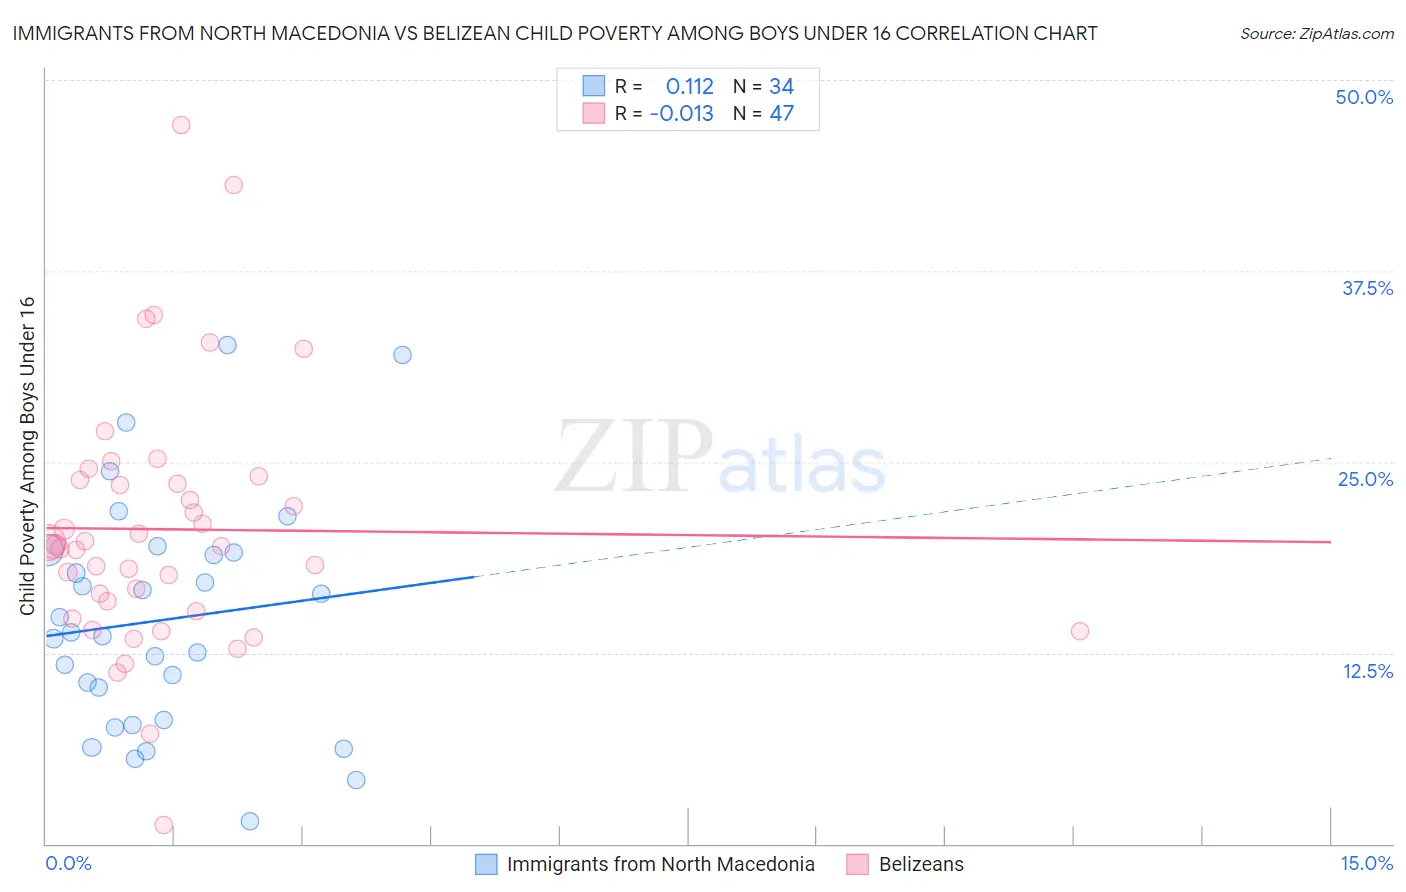
Immigrants from North Macedonia vs Belizean Child Poverty Among Boys Under 16 Correlation Chart
The statistical analysis conducted on geographies consisting of 73,631,017 people shows a poor positive correlation between the proportion of Immigrants from North Macedonia and poverty level among boys under the age of 16 in the United States with a correlation coefficient (R) of 0.112 and weighted average of 14.9%. Similarly, the statistical analysis conducted on geographies consisting of 143,705,022 people shows no correlation between the proportion of Belizeans and poverty level among boys under the age of 16 in the United States with a correlation coefficient (R) of -0.013 and weighted average of 19.9%, a difference of 33.0%.
Child Poverty Among Boys Under 16 Correlation Summary
| Measurement | Immigrants from North Macedonia | Belizean |
| Minimum | 1.4% | 1.2% |
| Maximum | 32.7% | 47.1% |
| Range | 31.2% | 45.9% |
| Mean | 14.7% | 20.6% |
| Median | 13.7% | 19.5% |
| Interquartile 25% (IQ1) | 8.1% | 15.2% |
| Interquartile 75% (IQ3) | 19.1% | 23.8% |
| Interquartile Range (IQR) | 11.0% | 8.6% |
| Standard Deviation (Sample) | 7.6% | 8.4% |
| Standard Deviation (Population) | 7.4% | 8.3% |
Similar Demographics by Child Poverty Among Boys Under 16
Demographics Similar to Immigrants from North Macedonia by Child Poverty Among Boys Under 16
In terms of child poverty among boys under 16, the demographic groups most similar to Immigrants from North Macedonia are Immigrants from Egypt (14.9%, a difference of 0.010%), British (15.0%, a difference of 0.050%), Immigrants from France (15.0%, a difference of 0.15%), Finnish (14.9%, a difference of 0.25%), and Sri Lankan (14.9%, a difference of 0.36%).
| Demographics | Rating | Rank | Child Poverty Among Boys Under 16 |
| Immigrants | Argentina | 97.1 /100 | #89 | Exceptional 14.8% |
| Austrians | 97.1 /100 | #90 | Exceptional 14.8% |
| Paraguayans | 96.8 /100 | #91 | Exceptional 14.9% |
| Argentineans | 96.7 /100 | #92 | Exceptional 14.9% |
| Sri Lankans | 96.7 /100 | #93 | Exceptional 14.9% |
| Immigrants | Italy | 96.7 /100 | #94 | Exceptional 14.9% |
| Finns | 96.5 /100 | #95 | Exceptional 14.9% |
| Immigrants | North Macedonia | 96.3 /100 | #96 | Exceptional 14.9% |
| Immigrants | Egypt | 96.2 /100 | #97 | Exceptional 14.9% |
| British | 96.2 /100 | #98 | Exceptional 15.0% |
| Immigrants | France | 96.1 /100 | #99 | Exceptional 15.0% |
| Chileans | 95.8 /100 | #100 | Exceptional 15.0% |
| Immigrants | Belarus | 95.7 /100 | #101 | Exceptional 15.0% |
| Romanians | 95.6 /100 | #102 | Exceptional 15.0% |
| Immigrants | Denmark | 95.6 /100 | #103 | Exceptional 15.0% |
Demographics Similar to Belizeans by Child Poverty Among Boys Under 16
In terms of child poverty among boys under 16, the demographic groups most similar to Belizeans are Immigrants from Ecuador (19.8%, a difference of 0.14%), Immigrants from Bangladesh (19.9%, a difference of 0.25%), Chickasaw (19.8%, a difference of 0.36%), Jamaican (20.0%, a difference of 0.38%), and Subsaharan African (20.0%, a difference of 0.55%).
| Demographics | Rating | Rank | Child Poverty Among Boys Under 16 |
| Immigrants | El Salvador | 0.1 /100 | #266 | Tragic 19.6% |
| Vietnamese | 0.1 /100 | #267 | Tragic 19.6% |
| Spanish American Indians | 0.1 /100 | #268 | Tragic 19.6% |
| Immigrants | Cabo Verde | 0.1 /100 | #269 | Tragic 19.7% |
| Cherokee | 0.1 /100 | #270 | Tragic 19.7% |
| Chickasaw | 0.1 /100 | #271 | Tragic 19.8% |
| Immigrants | Ecuador | 0.1 /100 | #272 | Tragic 19.8% |
| Belizeans | 0.1 /100 | #273 | Tragic 19.9% |
| Immigrants | Bangladesh | 0.0 /100 | #274 | Tragic 19.9% |
| Jamaicans | 0.0 /100 | #275 | Tragic 20.0% |
| Sub-Saharan Africans | 0.0 /100 | #276 | Tragic 20.0% |
| Immigrants | Barbados | 0.0 /100 | #277 | Tragic 20.0% |
| Immigrants | West Indies | 0.0 /100 | #278 | Tragic 20.0% |
| Bangladeshis | 0.0 /100 | #279 | Tragic 20.0% |
| Central Americans | 0.0 /100 | #280 | Tragic 20.1% |