Immigrants from Nicaragua vs Hispanic or Latino Child Poverty Under the Age of 16
COMPARE
Immigrants from Nicaragua
Hispanic or Latino
Child Poverty Under the Age of 16
Child Poverty Under the Age of 16 Comparison
Immigrants from Nicaragua
Hispanics or Latinos
18.8%
CHILD POVERTY UNDER THE AGE OF 16
0.4/ 100
METRIC RATING
246th/ 347
METRIC RANK
20.8%
CHILD POVERTY UNDER THE AGE OF 16
0.0/ 100
METRIC RATING
297th/ 347
METRIC RANK
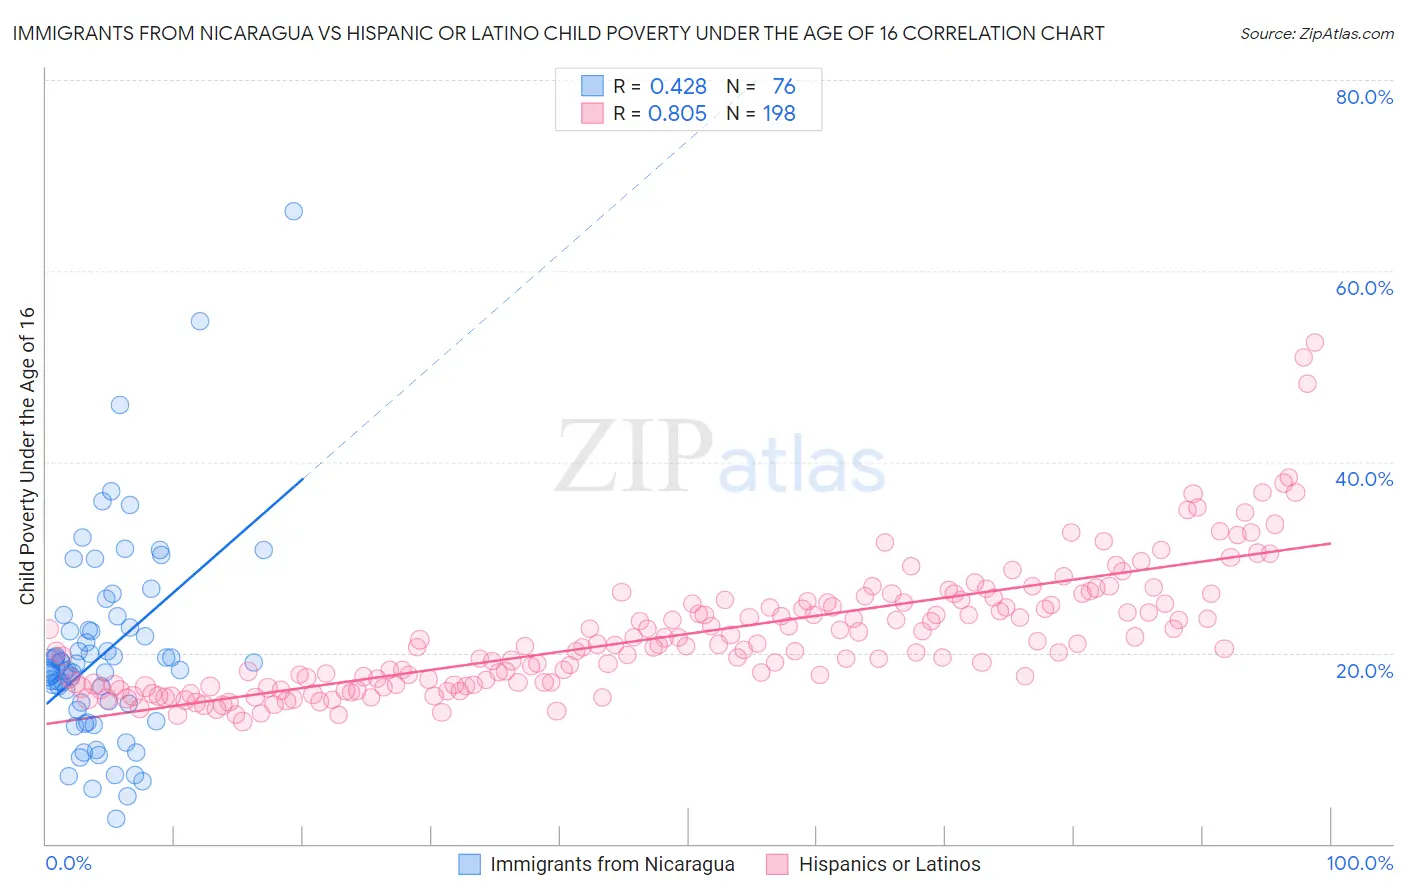
Immigrants from Nicaragua vs Hispanic or Latino Child Poverty Under the Age of 16 Correlation Chart
The statistical analysis conducted on geographies consisting of 235,832,733 people shows a moderate positive correlation between the proportion of Immigrants from Nicaragua and poverty level among children under the age of 16 in the United States with a correlation coefficient (R) of 0.428 and weighted average of 18.8%. Similarly, the statistical analysis conducted on geographies consisting of 562,230,949 people shows a very strong positive correlation between the proportion of Hispanics or Latinos and poverty level among children under the age of 16 in the United States with a correlation coefficient (R) of 0.805 and weighted average of 20.8%, a difference of 10.4%.
Child Poverty Under the Age of 16 Correlation Summary
| Measurement | Immigrants from Nicaragua | Hispanic or Latino |
| Minimum | 2.6% | 12.8% |
| Maximum | 66.2% | 52.5% |
| Range | 63.6% | 39.7% |
| Mean | 20.0% | 21.9% |
| Median | 18.3% | 20.6% |
| Interquartile 25% (IQ1) | 14.3% | 16.6% |
| Interquartile 75% (IQ3) | 22.5% | 25.2% |
| Interquartile Range (IQR) | 8.1% | 8.6% |
| Standard Deviation (Sample) | 10.5% | 6.7% |
| Standard Deviation (Population) | 10.5% | 6.7% |
Similar Demographics by Child Poverty Under the Age of 16
Demographics Similar to Immigrants from Nicaragua by Child Poverty Under the Age of 16
In terms of child poverty under the age of 16, the demographic groups most similar to Immigrants from Nicaragua are Shoshone (18.8%, a difference of 0.030%), French American Indian (18.9%, a difference of 0.24%), Ecuadorian (19.0%, a difference of 0.67%), Cape Verdean (18.7%, a difference of 0.68%), and Immigrants from Cuba (18.7%, a difference of 0.75%).
| Demographics | Rating | Rank | Child Poverty Under the Age of 16 |
| Immigrants | Sudan | 0.8 /100 | #239 | Tragic 18.5% |
| Ghanaians | 0.8 /100 | #240 | Tragic 18.6% |
| Alsatians | 0.7 /100 | #241 | Tragic 18.6% |
| Immigrants | Laos | 0.6 /100 | #242 | Tragic 18.7% |
| Immigrants | Cuba | 0.6 /100 | #243 | Tragic 18.7% |
| Cape Verdeans | 0.6 /100 | #244 | Tragic 18.7% |
| Shoshone | 0.5 /100 | #245 | Tragic 18.8% |
| Immigrants | Nicaragua | 0.4 /100 | #246 | Tragic 18.8% |
| French American Indians | 0.4 /100 | #247 | Tragic 18.9% |
| Ecuadorians | 0.3 /100 | #248 | Tragic 19.0% |
| Potawatomi | 0.3 /100 | #249 | Tragic 19.0% |
| Immigrants | Middle Africa | 0.3 /100 | #250 | Tragic 19.0% |
| Immigrants | Ghana | 0.3 /100 | #251 | Tragic 19.1% |
| Immigrants | Trinidad and Tobago | 0.3 /100 | #252 | Tragic 19.1% |
| Salvadorans | 0.3 /100 | #253 | Tragic 19.1% |
Demographics Similar to Hispanics or Latinos by Child Poverty Under the Age of 16
In terms of child poverty under the age of 16, the demographic groups most similar to Hispanics or Latinos are Arapaho (20.8%, a difference of 0.0%), Immigrants from Caribbean (20.8%, a difference of 0.13%), Immigrants from Haiti (20.9%, a difference of 0.31%), Mexican (20.7%, a difference of 0.51%), and Haitian (20.7%, a difference of 0.65%).
| Demographics | Rating | Rank | Child Poverty Under the Age of 16 |
| Yaqui | 0.0 /100 | #290 | Tragic 20.4% |
| Chippewa | 0.0 /100 | #291 | Tragic 20.5% |
| Immigrants | Latin America | 0.0 /100 | #292 | Tragic 20.5% |
| Immigrants | Senegal | 0.0 /100 | #293 | Tragic 20.6% |
| Haitians | 0.0 /100 | #294 | Tragic 20.7% |
| Mexicans | 0.0 /100 | #295 | Tragic 20.7% |
| Immigrants | Caribbean | 0.0 /100 | #296 | Tragic 20.8% |
| Hispanics or Latinos | 0.0 /100 | #297 | Tragic 20.8% |
| Arapaho | 0.0 /100 | #298 | Tragic 20.8% |
| Immigrants | Haiti | 0.0 /100 | #299 | Tragic 20.9% |
| Indonesians | 0.0 /100 | #300 | Tragic 21.0% |
| Immigrants | Grenada | 0.0 /100 | #301 | Tragic 21.0% |
| Immigrants | Bahamas | 0.0 /100 | #302 | Tragic 21.0% |
| Choctaw | 0.0 /100 | #303 | Tragic 21.0% |
| Somalis | 0.0 /100 | #304 | Tragic 21.0% |