Yuman vs Immigrants from Portugal Child Poverty Among Boys Under 16
COMPARE
Yuman
Immigrants from Portugal
Child Poverty Among Boys Under 16
Child Poverty Among Boys Under 16 Comparison
Yuman
Immigrants from Portugal
30.6%
CHILD POVERTY AMONG BOYS UNDER 16
0.0/ 100
METRIC RATING
344th/ 347
METRIC RANK
17.4%
CHILD POVERTY AMONG BOYS UNDER 16
11.2/ 100
METRIC RATING
205th/ 347
METRIC RANK
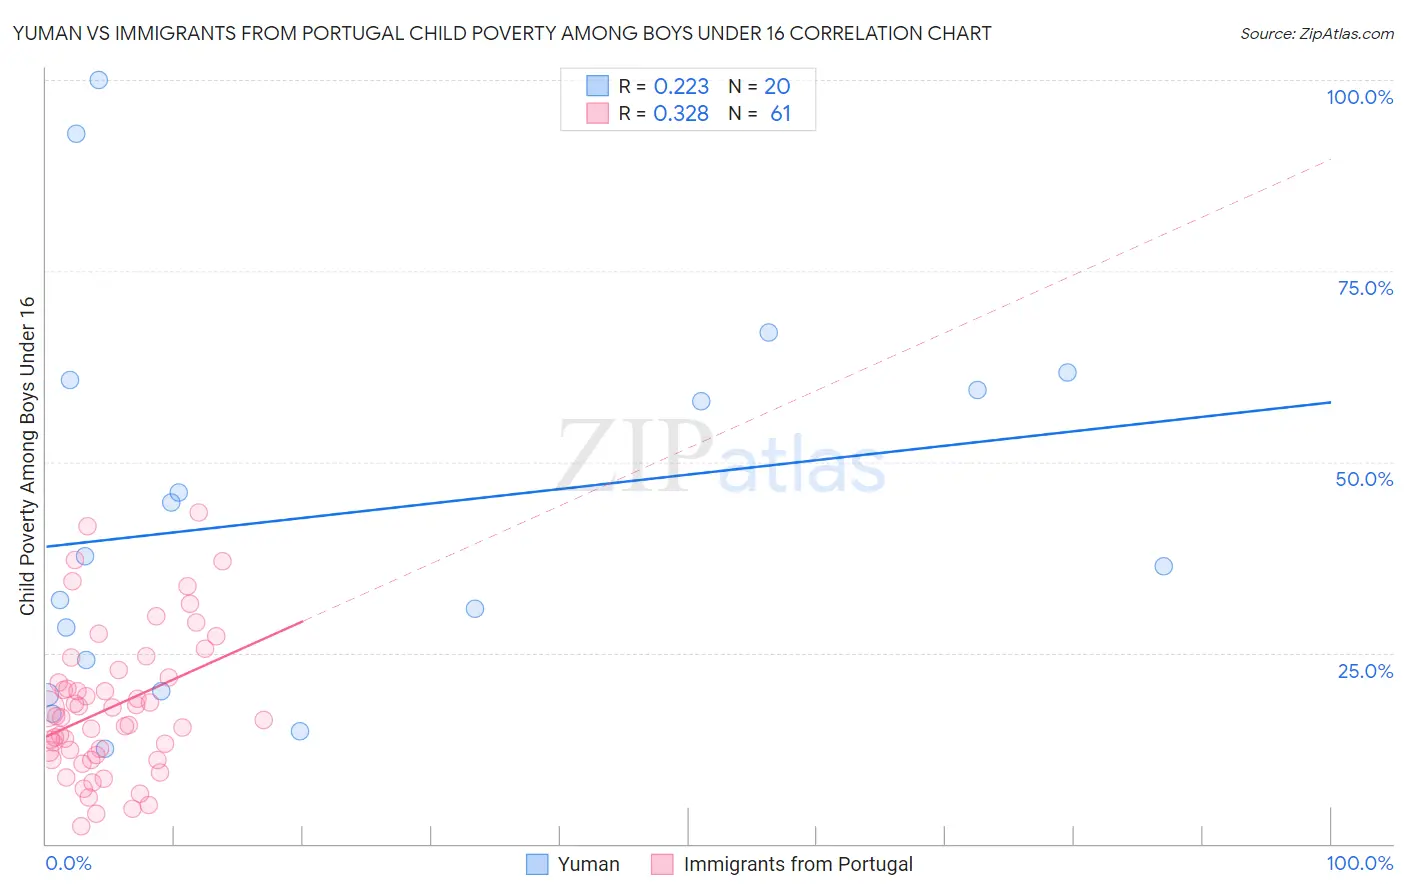
Yuman vs Immigrants from Portugal Child Poverty Among Boys Under 16 Correlation Chart
The statistical analysis conducted on geographies consisting of 40,605,786 people shows a weak positive correlation between the proportion of Yuman and poverty level among boys under the age of 16 in the United States with a correlation coefficient (R) of 0.223 and weighted average of 30.6%. Similarly, the statistical analysis conducted on geographies consisting of 172,490,007 people shows a mild positive correlation between the proportion of Immigrants from Portugal and poverty level among boys under the age of 16 in the United States with a correlation coefficient (R) of 0.328 and weighted average of 17.4%, a difference of 76.2%.
Child Poverty Among Boys Under 16 Correlation Summary
| Measurement | Yuman | Immigrants from Portugal |
| Minimum | 12.5% | 2.3% |
| Maximum | 100.0% | 43.4% |
| Range | 87.5% | 41.1% |
| Mean | 43.2% | 17.9% |
| Median | 37.0% | 16.6% |
| Interquartile 25% (IQ1) | 22.0% | 11.4% |
| Interquartile 75% (IQ3) | 60.0% | 22.3% |
| Interquartile Range (IQR) | 38.0% | 10.9% |
| Standard Deviation (Sample) | 25.0% | 9.4% |
| Standard Deviation (Population) | 24.4% | 9.3% |
Similar Demographics by Child Poverty Among Boys Under 16
Demographics Similar to Yuman by Child Poverty Among Boys Under 16
In terms of child poverty among boys under 16, the demographic groups most similar to Yuman are Navajo (30.3%, a difference of 1.2%), Tohono O'odham (31.6%, a difference of 3.0%), Pima (29.7%, a difference of 3.0%), Lumbee (31.9%, a difference of 4.2%), and Immigrants from Yemen (28.9%, a difference of 6.2%).
| Demographics | Rating | Rank | Child Poverty Among Boys Under 16 |
| Apache | 0.0 /100 | #333 | Tragic 24.5% |
| Blacks/African Americans | 0.0 /100 | #334 | Tragic 24.5% |
| Yup'ik | 0.0 /100 | #335 | Tragic 24.7% |
| Sioux | 0.0 /100 | #336 | Tragic 25.3% |
| Cheyenne | 0.0 /100 | #337 | Tragic 25.8% |
| Hopi | 0.0 /100 | #338 | Tragic 25.9% |
| Houma | 0.0 /100 | #339 | Tragic 26.2% |
| Crow | 0.0 /100 | #340 | Tragic 26.3% |
| Immigrants | Yemen | 0.0 /100 | #341 | Tragic 28.9% |
| Pima | 0.0 /100 | #342 | Tragic 29.7% |
| Navajo | 0.0 /100 | #343 | Tragic 30.3% |
| Yuman | 0.0 /100 | #344 | Tragic 30.6% |
| Tohono O'odham | 0.0 /100 | #345 | Tragic 31.6% |
| Lumbee | 0.0 /100 | #346 | Tragic 31.9% |
| Puerto Ricans | 0.0 /100 | #347 | Tragic 32.8% |
Demographics Similar to Immigrants from Portugal by Child Poverty Among Boys Under 16
In terms of child poverty among boys under 16, the demographic groups most similar to Immigrants from Portugal are German Russian (17.4%, a difference of 0.060%), Ugandan (17.3%, a difference of 0.33%), Immigrants from Uzbekistan (17.3%, a difference of 0.53%), Immigrants from Sierra Leone (17.3%, a difference of 0.55%), and Immigrants from Afghanistan (17.3%, a difference of 0.62%).
| Demographics | Rating | Rank | Child Poverty Among Boys Under 16 |
| Immigrants | Cameroon | 19.0 /100 | #198 | Poor 17.1% |
| Delaware | 18.8 /100 | #199 | Poor 17.1% |
| Immigrants | Uruguay | 16.9 /100 | #200 | Poor 17.2% |
| Immigrants | Afghanistan | 13.7 /100 | #201 | Poor 17.3% |
| Immigrants | Sierra Leone | 13.4 /100 | #202 | Poor 17.3% |
| Immigrants | Uzbekistan | 13.3 /100 | #203 | Poor 17.3% |
| Ugandans | 12.5 /100 | #204 | Poor 17.3% |
| Immigrants | Portugal | 11.2 /100 | #205 | Poor 17.4% |
| German Russians | 10.9 /100 | #206 | Poor 17.4% |
| Immigrants | Thailand | 8.2 /100 | #207 | Tragic 17.5% |
| Malaysians | 7.6 /100 | #208 | Tragic 17.6% |
| Alaskan Athabascans | 7.3 /100 | #209 | Tragic 17.6% |
| Immigrants | Armenia | 6.8 /100 | #210 | Tragic 17.6% |
| Immigrants | Immigrants | 6.7 /100 | #211 | Tragic 17.6% |
| Aleuts | 6.6 /100 | #212 | Tragic 17.7% |