Nepalese vs Immigrants from Portugal Unemployment Among Ages 65 to 74 years
COMPARE
Nepalese
Immigrants from Portugal
Unemployment Among Ages 65 to 74 years
Unemployment Among Ages 65 to 74 years Comparison
Nepalese
Immigrants from Portugal
5.0%
UNEMPLOYMENT AMONG AGES 65 TO 74 YEARS
99.9/ 100
METRIC RATING
38th/ 347
METRIC RANK
6.0%
UNEMPLOYMENT AMONG AGES 65 TO 74 YEARS
0.0/ 100
METRIC RATING
325th/ 347
METRIC RANK
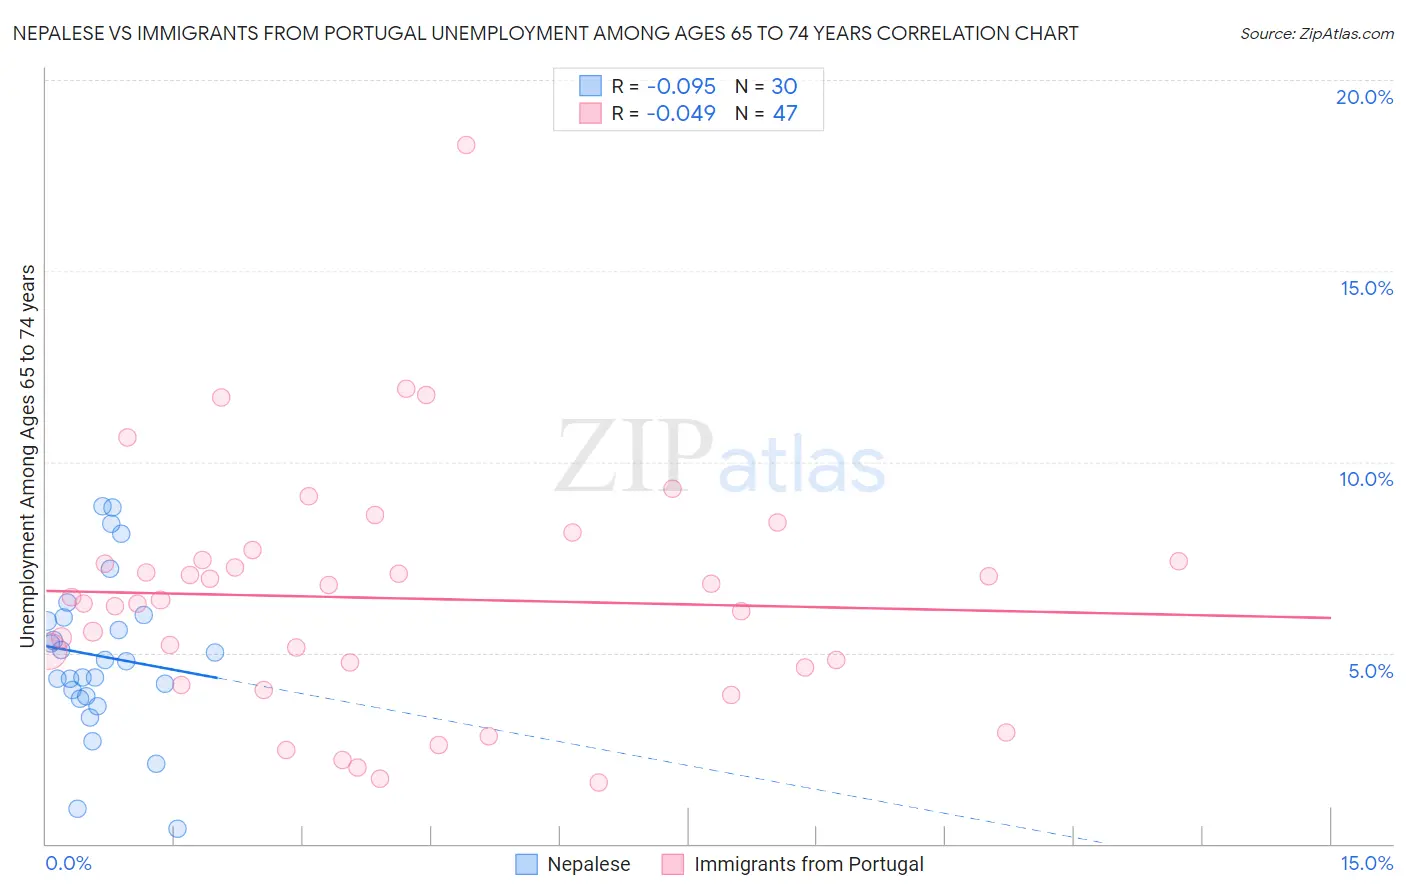
Nepalese vs Immigrants from Portugal Unemployment Among Ages 65 to 74 years Correlation Chart
The statistical analysis conducted on geographies consisting of 23,862,004 people shows a slight negative correlation between the proportion of Nepalese and unemployment rate among population between the ages 65 and 74 in the United States with a correlation coefficient (R) of -0.095 and weighted average of 5.0%. Similarly, the statistical analysis conducted on geographies consisting of 164,585,915 people shows no correlation between the proportion of Immigrants from Portugal and unemployment rate among population between the ages 65 and 74 in the United States with a correlation coefficient (R) of -0.049 and weighted average of 6.0%, a difference of 19.5%.
Unemployment Among Ages 65 to 74 years Correlation Summary
| Measurement | Nepalese | Immigrants from Portugal |
| Minimum | 0.40% | 1.6% |
| Maximum | 8.8% | 18.3% |
| Range | 8.4% | 16.7% |
| Mean | 4.9% | 6.4% |
| Median | 4.8% | 6.4% |
| Interquartile 25% (IQ1) | 3.9% | 4.6% |
| Interquartile 75% (IQ3) | 5.9% | 7.4% |
| Interquartile Range (IQR) | 2.1% | 2.8% |
| Standard Deviation (Sample) | 2.1% | 3.1% |
| Standard Deviation (Population) | 2.0% | 3.1% |
Similar Demographics by Unemployment Among Ages 65 to 74 years
Demographics Similar to Nepalese by Unemployment Among Ages 65 to 74 years
In terms of unemployment among ages 65 to 74 years, the demographic groups most similar to Nepalese are Immigrants from Sweden (5.0%, a difference of 0.010%), Immigrants from Iraq (5.1%, a difference of 0.19%), Ugandan (5.1%, a difference of 0.20%), Immigrants from Eastern Africa (5.0%, a difference of 0.22%), and Immigrants from Kuwait (5.0%, a difference of 0.24%).
| Demographics | Rating | Rank | Unemployment Among Ages 65 to 74 years |
| Slovenes | 100.0 /100 | #31 | Exceptional 5.0% |
| Palestinians | 100.0 /100 | #32 | Exceptional 5.0% |
| Belgians | 100.0 /100 | #33 | Exceptional 5.0% |
| Cambodians | 100.0 /100 | #34 | Exceptional 5.0% |
| Bhutanese | 100.0 /100 | #35 | Exceptional 5.0% |
| Immigrants | Kuwait | 99.9 /100 | #36 | Exceptional 5.0% |
| Immigrants | Eastern Africa | 99.9 /100 | #37 | Exceptional 5.0% |
| Nepalese | 99.9 /100 | #38 | Exceptional 5.0% |
| Immigrants | Sweden | 99.9 /100 | #39 | Exceptional 5.0% |
| Immigrants | Iraq | 99.9 /100 | #40 | Exceptional 5.1% |
| Ugandans | 99.9 /100 | #41 | Exceptional 5.1% |
| Jordanians | 99.9 /100 | #42 | Exceptional 5.1% |
| Assyrians/Chaldeans/Syriacs | 99.9 /100 | #43 | Exceptional 5.1% |
| Immigrants | India | 99.9 /100 | #44 | Exceptional 5.1% |
| Sioux | 99.8 /100 | #45 | Exceptional 5.1% |
Demographics Similar to Immigrants from Portugal by Unemployment Among Ages 65 to 74 years
In terms of unemployment among ages 65 to 74 years, the demographic groups most similar to Immigrants from Portugal are Tohono O'odham (6.0%, a difference of 0.12%), Native/Alaskan (6.0%, a difference of 0.24%), Delaware (6.0%, a difference of 0.69%), Immigrants from Mexico (6.0%, a difference of 0.75%), and Immigrants from Dominica (6.0%, a difference of 0.97%).
| Demographics | Rating | Rank | Unemployment Among Ages 65 to 74 years |
| Zimbabweans | 0.0 /100 | #318 | Tragic 5.9% |
| Aleuts | 0.0 /100 | #319 | Tragic 5.9% |
| Immigrants | Bahamas | 0.0 /100 | #320 | Tragic 5.9% |
| Immigrants | Dominica | 0.0 /100 | #321 | Tragic 6.0% |
| Immigrants | Mexico | 0.0 /100 | #322 | Tragic 6.0% |
| Delaware | 0.0 /100 | #323 | Tragic 6.0% |
| Tohono O'odham | 0.0 /100 | #324 | Tragic 6.0% |
| Immigrants | Portugal | 0.0 /100 | #325 | Tragic 6.0% |
| Natives/Alaskans | 0.0 /100 | #326 | Tragic 6.0% |
| Shoshone | 0.0 /100 | #327 | Tragic 6.2% |
| Immigrants | Azores | 0.0 /100 | #328 | Tragic 6.2% |
| Yuman | 0.0 /100 | #329 | Tragic 6.2% |
| Dominicans | 0.0 /100 | #330 | Tragic 6.3% |
| Bermudans | 0.0 /100 | #331 | Tragic 6.3% |
| Immigrants | Dominican Republic | 0.0 /100 | #332 | Tragic 6.3% |