Nepalese vs Cheyenne 9th Grade
COMPARE
Nepalese
Cheyenne
9th Grade
9th Grade Comparison
Nepalese
Cheyenne
92.0%
9TH GRADE
0.0/ 100
METRIC RATING
318th/ 347
METRIC RANK
94.9%
9TH GRADE
51.5/ 100
METRIC RATING
173rd/ 347
METRIC RANK
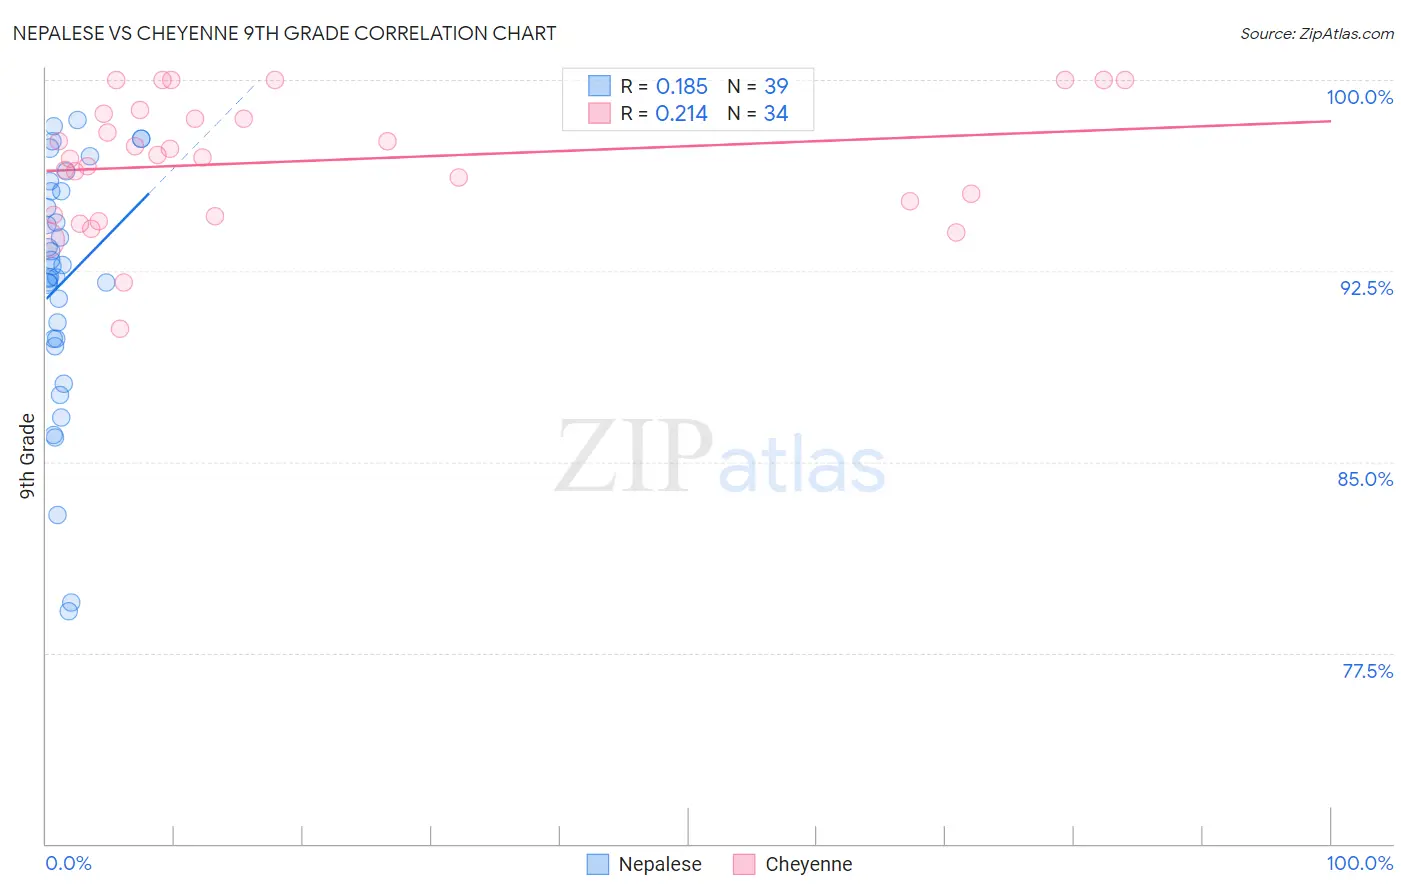
Nepalese vs Cheyenne 9th Grade Correlation Chart
The statistical analysis conducted on geographies consisting of 24,519,269 people shows a poor positive correlation between the proportion of Nepalese and percentage of population with at least 9th grade education in the United States with a correlation coefficient (R) of 0.185 and weighted average of 92.0%. Similarly, the statistical analysis conducted on geographies consisting of 80,719,411 people shows a weak positive correlation between the proportion of Cheyenne and percentage of population with at least 9th grade education in the United States with a correlation coefficient (R) of 0.214 and weighted average of 94.9%, a difference of 3.2%.
9th Grade Correlation Summary
| Measurement | Nepalese | Cheyenne |
| Minimum | 79.1% | 90.2% |
| Maximum | 98.4% | 100.0% |
| Range | 19.3% | 9.8% |
| Mean | 92.1% | 96.8% |
| Median | 92.7% | 97.0% |
| Interquartile 25% (IQ1) | 89.8% | 94.7% |
| Interquartile 75% (IQ3) | 95.6% | 98.7% |
| Interquartile Range (IQR) | 5.8% | 4.0% |
| Standard Deviation (Sample) | 4.8% | 2.5% |
| Standard Deviation (Population) | 4.7% | 2.4% |
Similar Demographics by 9th Grade
Demographics Similar to Nepalese by 9th Grade
In terms of 9th grade, the demographic groups most similar to Nepalese are Ecuadorian (91.9%, a difference of 0.050%), Nicaraguan (91.9%, a difference of 0.090%), Immigrants from Ecuador (91.8%, a difference of 0.16%), Belizean (91.8%, a difference of 0.19%), and Puerto Rican (91.8%, a difference of 0.19%).
| Demographics | Rating | Rank | 9th Grade |
| Immigrants | Fiji | 0.0 /100 | #311 | Tragic 92.3% |
| Houma | 0.0 /100 | #312 | Tragic 92.3% |
| Vietnamese | 0.0 /100 | #313 | Tragic 92.3% |
| Immigrants | Portugal | 0.0 /100 | #314 | Tragic 92.2% |
| Immigrants | Caribbean | 0.0 /100 | #315 | Tragic 92.2% |
| Cape Verdeans | 0.0 /100 | #316 | Tragic 92.2% |
| Immigrants | Cuba | 0.0 /100 | #317 | Tragic 92.2% |
| Nepalese | 0.0 /100 | #318 | Tragic 92.0% |
| Ecuadorians | 0.0 /100 | #319 | Tragic 91.9% |
| Nicaraguans | 0.0 /100 | #320 | Tragic 91.9% |
| Immigrants | Ecuador | 0.0 /100 | #321 | Tragic 91.8% |
| Belizeans | 0.0 /100 | #322 | Tragic 91.8% |
| Puerto Ricans | 0.0 /100 | #323 | Tragic 91.8% |
| Immigrants | Belize | 0.0 /100 | #324 | Tragic 91.8% |
| Central American Indians | 0.0 /100 | #325 | Tragic 91.5% |
Demographics Similar to Cheyenne by 9th Grade
In terms of 9th grade, the demographic groups most similar to Cheyenne are Immigrants from Egypt (94.9%, a difference of 0.010%), Brazilian (94.9%, a difference of 0.010%), Iraqi (94.9%, a difference of 0.020%), Immigrants from Spain (94.9%, a difference of 0.020%), and Immigrants from Iraq (94.9%, a difference of 0.030%).
| Demographics | Rating | Rank | 9th Grade |
| Ute | 62.6 /100 | #166 | Good 95.0% |
| Immigrants | Brazil | 61.1 /100 | #167 | Good 95.0% |
| Chileans | 60.7 /100 | #168 | Good 95.0% |
| Spaniards | 59.6 /100 | #169 | Average 94.9% |
| Alsatians | 58.6 /100 | #170 | Average 94.9% |
| Colville | 58.5 /100 | #171 | Average 94.9% |
| Iraqis | 54.0 /100 | #172 | Average 94.9% |
| Cheyenne | 51.5 /100 | #173 | Average 94.9% |
| Immigrants | Egypt | 50.0 /100 | #174 | Average 94.9% |
| Brazilians | 49.8 /100 | #175 | Average 94.9% |
| Immigrants | Spain | 49.1 /100 | #176 | Average 94.9% |
| Immigrants | Iraq | 47.8 /100 | #177 | Average 94.9% |
| Immigrants | Poland | 46.7 /100 | #178 | Average 94.9% |
| Immigrants | Venezuela | 46.5 /100 | #179 | Average 94.9% |
| Immigrants | Uganda | 43.1 /100 | #180 | Average 94.8% |