Guyanese vs Okinawan Seniors Poverty Over the Age of 75
COMPARE
Guyanese
Okinawan
Seniors Poverty Over the Age of 75
Seniors Poverty Over the Age of 75 Comparison
Guyanese
Okinawans
16.1%
SENIORS POVERTY OVER THE AGE OF 75
0.0/ 100
METRIC RATING
315th/ 347
METRIC RANK
12.1%
SENIORS POVERTY OVER THE AGE OF 75
56.3/ 100
METRIC RATING
165th/ 347
METRIC RANK
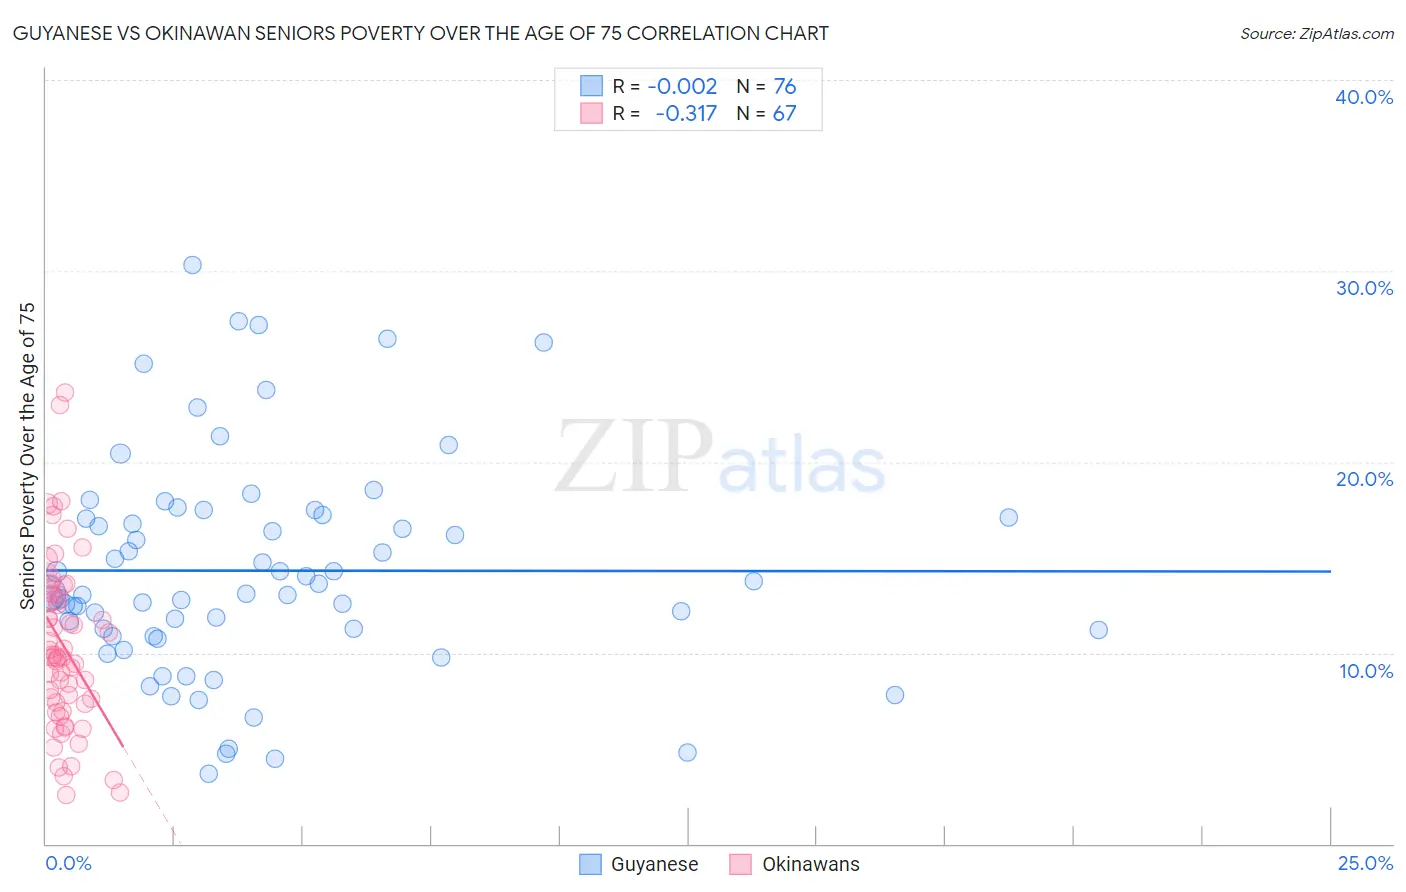
Guyanese vs Okinawan Seniors Poverty Over the Age of 75 Correlation Chart
The statistical analysis conducted on geographies consisting of 175,791,386 people shows no correlation between the proportion of Guyanese and poverty level among seniors over the age of 75 in the United States with a correlation coefficient (R) of -0.002 and weighted average of 16.1%. Similarly, the statistical analysis conducted on geographies consisting of 73,553,307 people shows a mild negative correlation between the proportion of Okinawans and poverty level among seniors over the age of 75 in the United States with a correlation coefficient (R) of -0.317 and weighted average of 12.1%, a difference of 33.0%.
Seniors Poverty Over the Age of 75 Correlation Summary
| Measurement | Guyanese | Okinawan |
| Minimum | 3.7% | 2.6% |
| Maximum | 30.3% | 23.6% |
| Range | 26.6% | 21.1% |
| Mean | 14.3% | 10.4% |
| Median | 13.1% | 9.8% |
| Interquartile 25% (IQ1) | 11.0% | 7.3% |
| Interquartile 75% (IQ3) | 17.1% | 13.1% |
| Interquartile Range (IQR) | 6.1% | 5.8% |
| Standard Deviation (Sample) | 5.7% | 4.5% |
| Standard Deviation (Population) | 5.6% | 4.4% |
Similar Demographics by Seniors Poverty Over the Age of 75
Demographics Similar to Guyanese by Seniors Poverty Over the Age of 75
In terms of seniors poverty over the age of 75, the demographic groups most similar to Guyanese are Immigrants from Ecuador (16.1%, a difference of 0.010%), Tsimshian (16.1%, a difference of 0.30%), Immigrants from Guyana (16.2%, a difference of 0.62%), Barbadian (16.0%, a difference of 0.66%), and Houma (16.2%, a difference of 0.75%).
| Demographics | Rating | Rank | Seniors Poverty Over the Age of 75 |
| Immigrants | Bangladesh | 0.0 /100 | #308 | Tragic 15.8% |
| Yup'ik | 0.0 /100 | #309 | Tragic 15.8% |
| Vietnamese | 0.0 /100 | #310 | Tragic 15.9% |
| Trinidadians and Tobagonians | 0.0 /100 | #311 | Tragic 15.9% |
| Crow | 0.0 /100 | #312 | Tragic 15.9% |
| Barbadians | 0.0 /100 | #313 | Tragic 16.0% |
| Tsimshian | 0.0 /100 | #314 | Tragic 16.1% |
| Guyanese | 0.0 /100 | #315 | Tragic 16.1% |
| Immigrants | Ecuador | 0.0 /100 | #316 | Tragic 16.1% |
| Immigrants | Guyana | 0.0 /100 | #317 | Tragic 16.2% |
| Houma | 0.0 /100 | #318 | Tragic 16.2% |
| Haitians | 0.0 /100 | #319 | Tragic 16.2% |
| Immigrants | Yemen | 0.0 /100 | #320 | Tragic 16.5% |
| Immigrants | Haiti | 0.0 /100 | #321 | Tragic 16.5% |
| Immigrants | Barbados | 0.0 /100 | #322 | Tragic 16.5% |
Demographics Similar to Okinawans by Seniors Poverty Over the Age of 75
In terms of seniors poverty over the age of 75, the demographic groups most similar to Okinawans are Potawatomi (12.1%, a difference of 0.090%), Egyptian (12.1%, a difference of 0.12%), Immigrants from Switzerland (12.1%, a difference of 0.14%), Immigrants from Greece (12.1%, a difference of 0.16%), and Immigrants from Syria (12.2%, a difference of 0.20%).
| Demographics | Rating | Rank | Seniors Poverty Over the Age of 75 |
| Portuguese | 61.3 /100 | #158 | Good 12.1% |
| Immigrants | Middle Africa | 61.2 /100 | #159 | Good 12.1% |
| Immigrants | Eastern Africa | 60.9 /100 | #160 | Good 12.1% |
| Immigrants | Norway | 60.6 /100 | #161 | Good 12.1% |
| Immigrants | Serbia | 60.2 /100 | #162 | Good 12.1% |
| Immigrants | Greece | 58.2 /100 | #163 | Average 12.1% |
| Potawatomi | 57.4 /100 | #164 | Average 12.1% |
| Okinawans | 56.3 /100 | #165 | Average 12.1% |
| Egyptians | 54.8 /100 | #166 | Average 12.1% |
| Immigrants | Switzerland | 54.5 /100 | #167 | Average 12.1% |
| Immigrants | Syria | 53.9 /100 | #168 | Average 12.2% |
| Immigrants | Egypt | 53.7 /100 | #169 | Average 12.2% |
| Immigrants | Thailand | 52.0 /100 | #170 | Average 12.2% |
| Spaniards | 51.6 /100 | #171 | Average 12.2% |
| Immigrants | Fiji | 51.5 /100 | #172 | Average 12.2% |