Navajo vs Immigrants from Asia Seniors Poverty Over the Age of 65
COMPARE
Navajo
Immigrants from Asia
Seniors Poverty Over the Age of 65
Seniors Poverty Over the Age of 65 Comparison
Navajo
Immigrants from Asia
17.5%
SENIORS POVERTY OVER THE AGE OF 65
0.0/ 100
METRIC RATING
339th/ 347
METRIC RANK
10.6%
SENIORS POVERTY OVER THE AGE OF 65
80.8/ 100
METRIC RATING
143rd/ 347
METRIC RANK
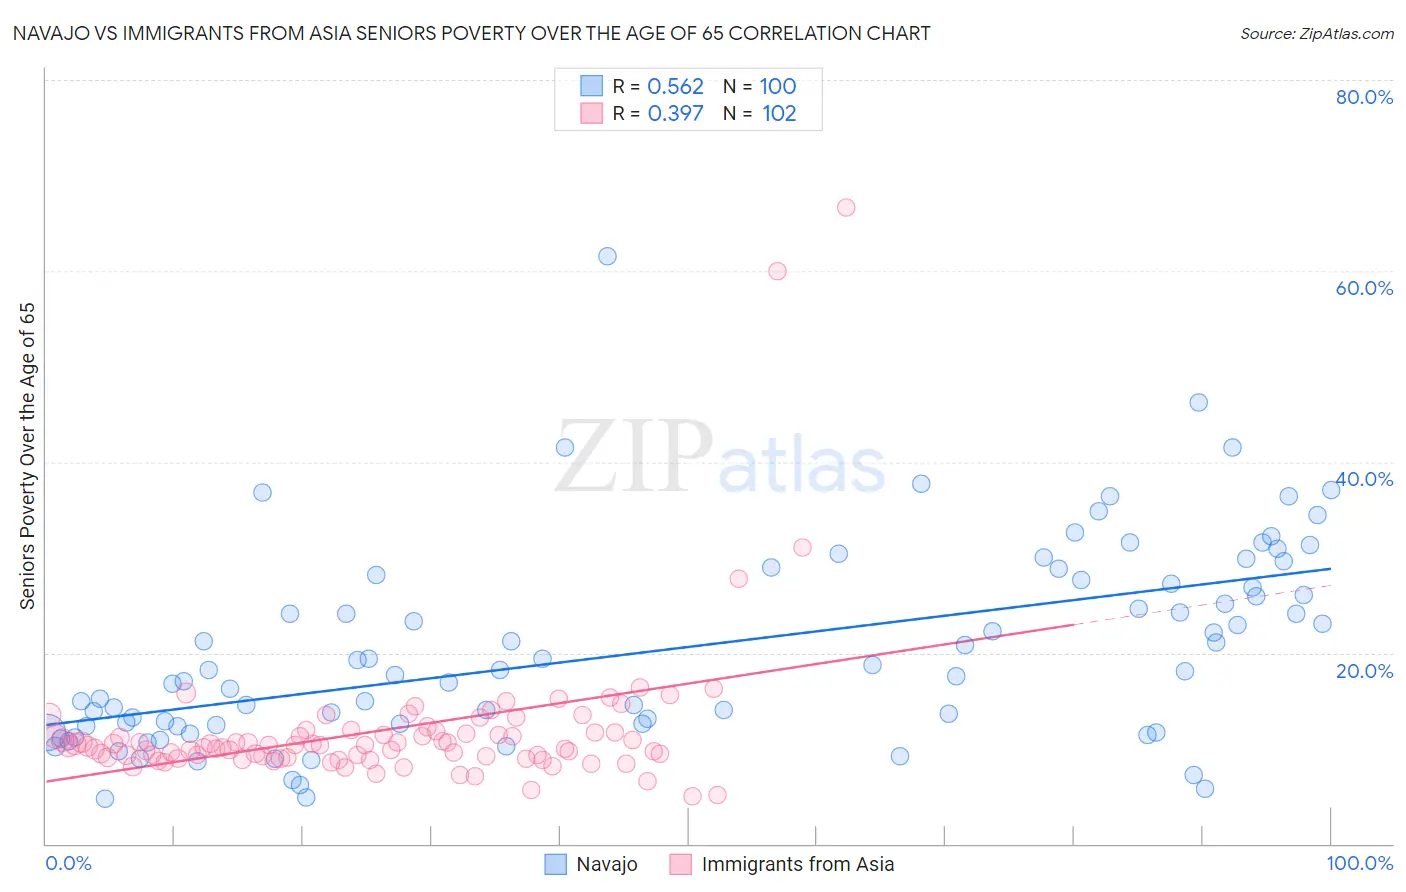
Navajo vs Immigrants from Asia Seniors Poverty Over the Age of 65 Correlation Chart
The statistical analysis conducted on geographies consisting of 223,980,676 people shows a substantial positive correlation between the proportion of Navajo and poverty level among seniors over the age of 65 in the United States with a correlation coefficient (R) of 0.562 and weighted average of 17.5%. Similarly, the statistical analysis conducted on geographies consisting of 544,973,749 people shows a mild positive correlation between the proportion of Immigrants from Asia and poverty level among seniors over the age of 65 in the United States with a correlation coefficient (R) of 0.397 and weighted average of 10.6%, a difference of 64.9%.
Seniors Poverty Over the Age of 65 Correlation Summary
| Measurement | Navajo | Immigrants from Asia |
| Minimum | 4.8% | 5.0% |
| Maximum | 61.5% | 66.7% |
| Range | 56.8% | 61.6% |
| Mean | 20.3% | 11.9% |
| Median | 18.1% | 10.3% |
| Interquartile 25% (IQ1) | 12.3% | 9.1% |
| Interquartile 75% (IQ3) | 27.5% | 11.6% |
| Interquartile Range (IQR) | 15.1% | 2.6% |
| Standard Deviation (Sample) | 10.4% | 8.1% |
| Standard Deviation (Population) | 10.4% | 8.1% |
Similar Demographics by Seniors Poverty Over the Age of 65
Demographics Similar to Navajo by Seniors Poverty Over the Age of 65
In terms of seniors poverty over the age of 65, the demographic groups most similar to Navajo are Pueblo (17.2%, a difference of 1.5%), Hopi (17.8%, a difference of 1.9%), Dominican (17.8%, a difference of 2.3%), Immigrants from Cuba (17.9%, a difference of 2.8%), and Lumbee (18.1%, a difference of 3.9%).
| Demographics | Rating | Rank | Seniors Poverty Over the Age of 65 |
| Immigrants | Grenada | 0.0 /100 | #332 | Tragic 15.8% |
| Immigrants | Yemen | 0.0 /100 | #333 | Tragic 15.9% |
| Immigrants | Nicaragua | 0.0 /100 | #334 | Tragic 15.9% |
| Cubans | 0.0 /100 | #335 | Tragic 16.1% |
| Immigrants | Cabo Verde | 0.0 /100 | #336 | Tragic 16.2% |
| Immigrants | Caribbean | 0.0 /100 | #337 | Tragic 16.5% |
| Pueblo | 0.0 /100 | #338 | Tragic 17.2% |
| Navajo | 0.0 /100 | #339 | Tragic 17.5% |
| Hopi | 0.0 /100 | #340 | Tragic 17.8% |
| Dominicans | 0.0 /100 | #341 | Tragic 17.8% |
| Immigrants | Cuba | 0.0 /100 | #342 | Tragic 17.9% |
| Lumbee | 0.0 /100 | #343 | Tragic 18.1% |
| Immigrants | Dominican Republic | 0.0 /100 | #344 | Tragic 18.3% |
| Pima | 0.0 /100 | #345 | Tragic 19.8% |
| Tohono O'odham | 0.0 /100 | #346 | Tragic 20.8% |
Demographics Similar to Immigrants from Asia by Seniors Poverty Over the Age of 65
In terms of seniors poverty over the age of 65, the demographic groups most similar to Immigrants from Asia are Iraqi (10.6%, a difference of 0.020%), Laotian (10.6%, a difference of 0.13%), Alaskan Athabascan (10.6%, a difference of 0.24%), Immigrants from Greece (10.6%, a difference of 0.26%), and Osage (10.6%, a difference of 0.32%).
| Demographics | Rating | Rank | Seniors Poverty Over the Age of 65 |
| Immigrants | Serbia | 86.4 /100 | #136 | Excellent 10.5% |
| Immigrants | Australia | 85.1 /100 | #137 | Excellent 10.5% |
| Immigrants | Latvia | 84.7 /100 | #138 | Excellent 10.5% |
| Portuguese | 84.1 /100 | #139 | Excellent 10.5% |
| Immigrants | Kenya | 83.4 /100 | #140 | Excellent 10.5% |
| Immigrants | Europe | 83.3 /100 | #141 | Excellent 10.5% |
| Osage | 82.8 /100 | #142 | Excellent 10.6% |
| Immigrants | Asia | 80.8 /100 | #143 | Excellent 10.6% |
| Iraqis | 80.7 /100 | #144 | Excellent 10.6% |
| Laotians | 79.9 /100 | #145 | Good 10.6% |
| Alaskan Athabascans | 79.1 /100 | #146 | Good 10.6% |
| Immigrants | Greece | 79.0 /100 | #147 | Good 10.6% |
| Americans | 78.1 /100 | #148 | Good 10.6% |
| Immigrants | Cameroon | 78.1 /100 | #149 | Good 10.6% |
| Immigrants | Switzerland | 77.3 /100 | #150 | Good 10.6% |