Immigrants from Romania vs Immigrants from Serbia Receiving Food Stamps
COMPARE
Immigrants from Romania
Immigrants from Serbia
Receiving Food Stamps
Receiving Food Stamps Comparison
Immigrants from Romania
Immigrants from Serbia
10.0%
RECEIVING FOOD STAMPS
98.5/ 100
METRIC RATING
85th/ 347
METRIC RANK
9.9%
RECEIVING FOOD STAMPS
99.0/ 100
METRIC RATING
70th/ 347
METRIC RANK
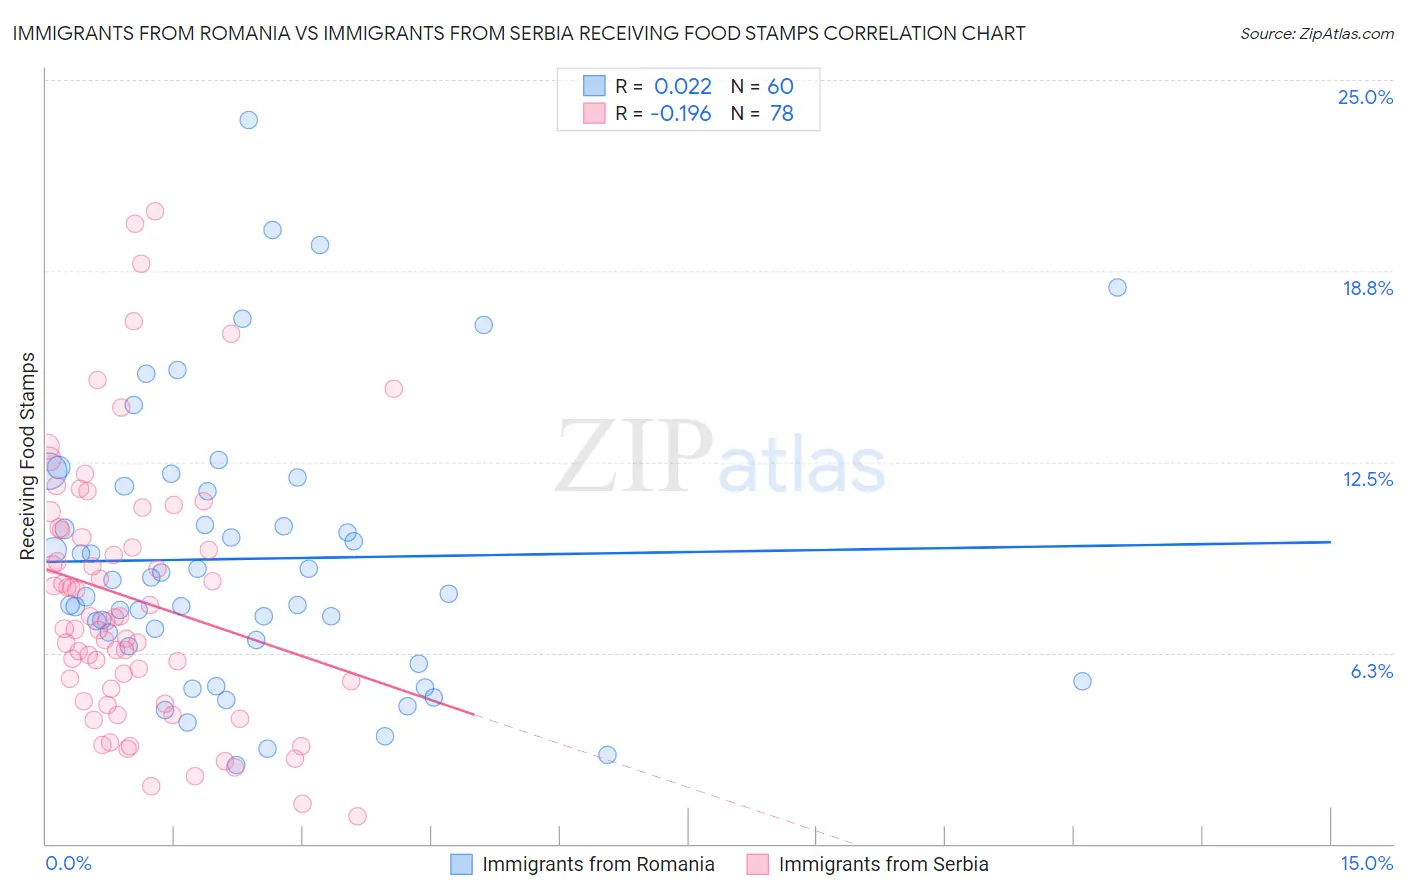
Immigrants from Romania vs Immigrants from Serbia Receiving Food Stamps Correlation Chart
The statistical analysis conducted on geographies consisting of 256,596,435 people shows no correlation between the proportion of Immigrants from Romania and percentage of population receiving government assistance and/or food stamps in the United States with a correlation coefficient (R) of 0.022 and weighted average of 10.0%. Similarly, the statistical analysis conducted on geographies consisting of 131,628,490 people shows a poor negative correlation between the proportion of Immigrants from Serbia and percentage of population receiving government assistance and/or food stamps in the United States with a correlation coefficient (R) of -0.196 and weighted average of 9.9%, a difference of 1.7%.
Receiving Food Stamps Correlation Summary
| Measurement | Immigrants from Romania | Immigrants from Serbia |
| Minimum | 2.6% | 0.90% |
| Maximum | 23.7% | 20.7% |
| Range | 21.1% | 19.8% |
| Mean | 9.3% | 8.0% |
| Median | 8.4% | 7.3% |
| Interquartile 25% (IQ1) | 6.6% | 5.1% |
| Interquartile 75% (IQ3) | 11.6% | 10.3% |
| Interquartile Range (IQR) | 5.1% | 5.2% |
| Standard Deviation (Sample) | 4.5% | 4.3% |
| Standard Deviation (Population) | 4.5% | 4.3% |
Demographics Similar to Immigrants from Romania and Immigrants from Serbia by Receiving Food Stamps
In terms of receiving food stamps, the demographic groups most similar to Immigrants from Romania are Immigrants from Norway (10.0%, a difference of 0.10%), Egyptian (10.0%, a difference of 0.13%), Immigrants from Israel (10.0%, a difference of 0.18%), Austrian (10.0%, a difference of 0.25%), and Dutch (10.0%, a difference of 0.25%). Similarly, the demographic groups most similar to Immigrants from Serbia are Italian (9.9%, a difference of 0.050%), Scottish (9.9%, a difference of 0.13%), Northern European (9.8%, a difference of 0.26%), Immigrants from Indonesia (9.8%, a difference of 0.32%), and Immigrants from Asia (9.9%, a difference of 0.37%).
| Demographics | Rating | Rank | Receiving Food Stamps |
| Immigrants | Indonesia | 99.0 /100 | #67 | Exceptional 9.8% |
| Northern Europeans | 99.0 /100 | #68 | Exceptional 9.8% |
| Italians | 99.0 /100 | #69 | Exceptional 9.9% |
| Immigrants | Serbia | 99.0 /100 | #70 | Exceptional 9.9% |
| Scottish | 98.9 /100 | #71 | Exceptional 9.9% |
| Immigrants | Asia | 98.9 /100 | #72 | Exceptional 9.9% |
| Macedonians | 98.9 /100 | #73 | Exceptional 9.9% |
| New Zealanders | 98.8 /100 | #74 | Exceptional 9.9% |
| Immigrants | Zimbabwe | 98.7 /100 | #75 | Exceptional 9.9% |
| Immigrants | Croatia | 98.7 /100 | #76 | Exceptional 10.0% |
| Immigrants | North Macedonia | 98.7 /100 | #77 | Exceptional 10.0% |
| South Africans | 98.7 /100 | #78 | Exceptional 10.0% |
| Laotians | 98.7 /100 | #79 | Exceptional 10.0% |
| Poles | 98.6 /100 | #80 | Exceptional 10.0% |
| Immigrants | England | 98.6 /100 | #81 | Exceptional 10.0% |
| Austrians | 98.6 /100 | #82 | Exceptional 10.0% |
| Dutch | 98.6 /100 | #83 | Exceptional 10.0% |
| Immigrants | Israel | 98.5 /100 | #84 | Exceptional 10.0% |
| Immigrants | Romania | 98.5 /100 | #85 | Exceptional 10.0% |
| Immigrants | Norway | 98.4 /100 | #86 | Exceptional 10.0% |
| Egyptians | 98.4 /100 | #87 | Exceptional 10.0% |