Immigrants from France vs Immigrants from Armenia Seniors Poverty Over the Age of 65
COMPARE
Immigrants from France
Immigrants from Armenia
Seniors Poverty Over the Age of 65
Seniors Poverty Over the Age of 65 Comparison
Immigrants from France
Immigrants from Armenia
11.0%
SENIORS POVERTY OVER THE AGE OF 65
40.9/ 100
METRIC RATING
184th/ 347
METRIC RANK
15.2%
SENIORS POVERTY OVER THE AGE OF 65
0.0/ 100
METRIC RATING
326th/ 347
METRIC RANK
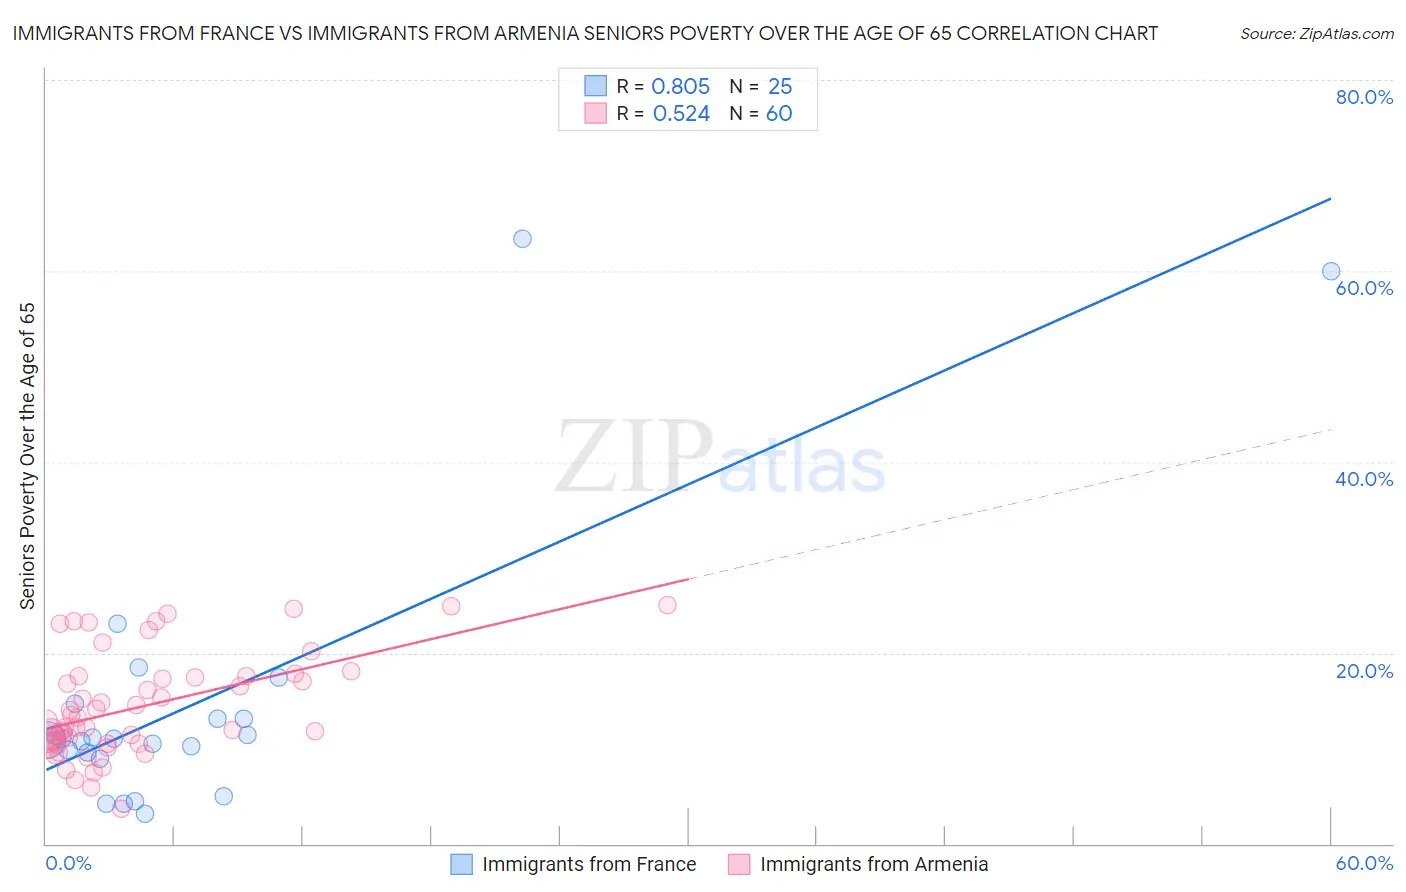
Immigrants from France vs Immigrants from Armenia Seniors Poverty Over the Age of 65 Correlation Chart
The statistical analysis conducted on geographies consisting of 287,379,710 people shows a very strong positive correlation between the proportion of Immigrants from France and poverty level among seniors over the age of 65 in the United States with a correlation coefficient (R) of 0.805 and weighted average of 11.0%. Similarly, the statistical analysis conducted on geographies consisting of 97,583,648 people shows a substantial positive correlation between the proportion of Immigrants from Armenia and poverty level among seniors over the age of 65 in the United States with a correlation coefficient (R) of 0.524 and weighted average of 15.2%, a difference of 37.7%.
Seniors Poverty Over the Age of 65 Correlation Summary
| Measurement | Immigrants from France | Immigrants from Armenia |
| Minimum | 3.1% | 3.6% |
| Maximum | 63.4% | 25.0% |
| Range | 60.3% | 21.4% |
| Mean | 14.8% | 14.3% |
| Median | 11.0% | 12.5% |
| Interquartile 25% (IQ1) | 9.2% | 10.5% |
| Interquartile 75% (IQ3) | 13.9% | 17.5% |
| Interquartile Range (IQR) | 4.7% | 7.0% |
| Standard Deviation (Sample) | 14.8% | 5.3% |
| Standard Deviation (Population) | 14.5% | 5.3% |
Similar Demographics by Seniors Poverty Over the Age of 65
Demographics Similar to Immigrants from France by Seniors Poverty Over the Age of 65
In terms of seniors poverty over the age of 65, the demographic groups most similar to Immigrants from France are Immigrants from Kazakhstan (11.0%, a difference of 0.010%), Immigrants from Fiji (11.0%, a difference of 0.10%), Immigrants from Thailand (11.0%, a difference of 0.23%), Immigrants from Eastern Africa (11.0%, a difference of 0.23%), and Immigrants from Lebanon (11.1%, a difference of 0.25%).
| Demographics | Rating | Rank | Seniors Poverty Over the Age of 65 |
| Cherokee | 47.3 /100 | #177 | Average 11.0% |
| German Russians | 46.9 /100 | #178 | Average 11.0% |
| Immigrants | Northern Africa | 44.6 /100 | #179 | Average 11.0% |
| Immigrants | Thailand | 43.5 /100 | #180 | Average 11.0% |
| Immigrants | Eastern Africa | 43.4 /100 | #181 | Average 11.0% |
| Immigrants | Fiji | 42.0 /100 | #182 | Average 11.0% |
| Immigrants | Kazakhstan | 41.0 /100 | #183 | Average 11.0% |
| Immigrants | France | 40.9 /100 | #184 | Average 11.0% |
| Immigrants | Lebanon | 38.2 /100 | #185 | Fair 11.1% |
| Immigrants | Eastern Asia | 37.5 /100 | #186 | Fair 11.1% |
| Immigrants | Middle Africa | 37.4 /100 | #187 | Fair 11.1% |
| Immigrants | Hong Kong | 36.3 /100 | #188 | Fair 11.1% |
| Immigrants | Laos | 35.7 /100 | #189 | Fair 11.1% |
| Indians (Asian) | 34.2 /100 | #190 | Fair 11.1% |
| Immigrants | Uganda | 32.2 /100 | #191 | Fair 11.1% |
Demographics Similar to Immigrants from Armenia by Seniors Poverty Over the Age of 65
In terms of seniors poverty over the age of 65, the demographic groups most similar to Immigrants from Armenia are Crow (15.2%, a difference of 0.25%), Central American Indian (15.1%, a difference of 0.60%), Sioux (15.3%, a difference of 0.79%), Nicaraguan (15.0%, a difference of 1.2%), and Immigrants from Dominica (15.5%, a difference of 1.9%).
| Demographics | Rating | Rank | Seniors Poverty Over the Age of 65 |
| Cape Verdeans | 0.0 /100 | #319 | Tragic 14.7% |
| Immigrants | Haiti | 0.0 /100 | #320 | Tragic 14.7% |
| Houma | 0.0 /100 | #321 | Tragic 14.7% |
| Immigrants | Barbados | 0.0 /100 | #322 | Tragic 14.8% |
| Yakama | 0.0 /100 | #323 | Tragic 14.8% |
| Nicaraguans | 0.0 /100 | #324 | Tragic 15.0% |
| Central American Indians | 0.0 /100 | #325 | Tragic 15.1% |
| Immigrants | Armenia | 0.0 /100 | #326 | Tragic 15.2% |
| Crow | 0.0 /100 | #327 | Tragic 15.2% |
| Sioux | 0.0 /100 | #328 | Tragic 15.3% |
| Immigrants | Dominica | 0.0 /100 | #329 | Tragic 15.5% |
| Immigrants | St. Vincent and the Grenadines | 0.0 /100 | #330 | Tragic 15.5% |
| British West Indians | 0.0 /100 | #331 | Tragic 15.6% |
| Immigrants | Grenada | 0.0 /100 | #332 | Tragic 15.8% |
| Immigrants | Yemen | 0.0 /100 | #333 | Tragic 15.9% |