Native Hawaiian vs Immigrants from Colombia Single Father Poverty
COMPARE
Native Hawaiian
Immigrants from Colombia
Single Father Poverty
Single Father Poverty Comparison
Native Hawaiians
Immigrants from Colombia
15.7%
SINGLE FATHER POVERTY
95.8/ 100
METRIC RATING
107th/ 347
METRIC RANK
15.8%
SINGLE FATHER POVERTY
92.6/ 100
METRIC RATING
117th/ 347
METRIC RANK
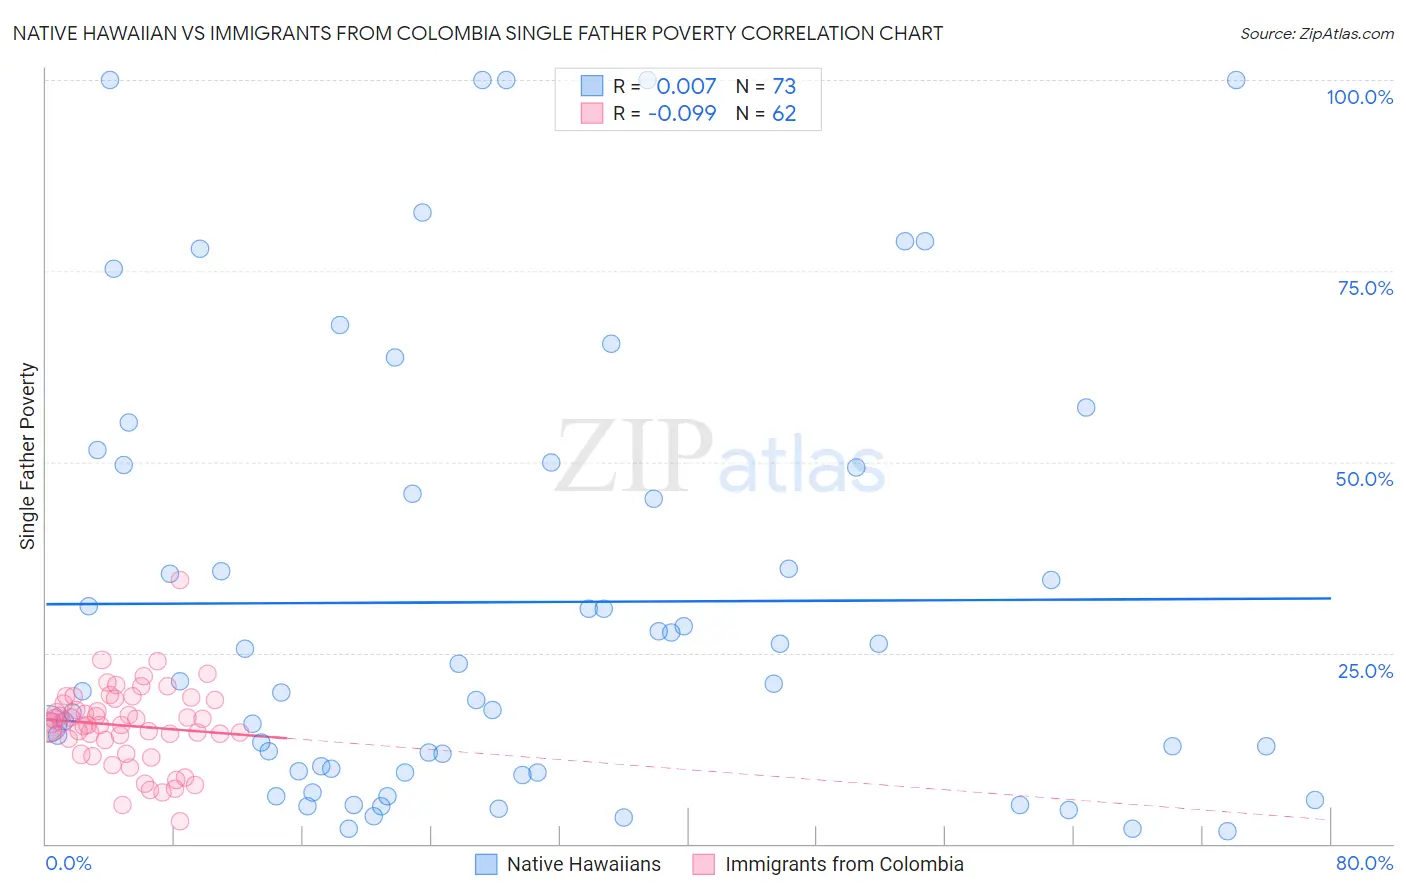
Native Hawaiian vs Immigrants from Colombia Single Father Poverty Correlation Chart
The statistical analysis conducted on geographies consisting of 273,491,221 people shows no correlation between the proportion of Native Hawaiians and poverty level among single fathers in the United States with a correlation coefficient (R) of 0.007 and weighted average of 15.7%. Similarly, the statistical analysis conducted on geographies consisting of 300,736,141 people shows a slight negative correlation between the proportion of Immigrants from Colombia and poverty level among single fathers in the United States with a correlation coefficient (R) of -0.099 and weighted average of 15.8%, a difference of 0.68%.
Single Father Poverty Correlation Summary
| Measurement | Native Hawaiian | Immigrants from Colombia |
| Minimum | 1.7% | 2.9% |
| Maximum | 100.0% | 34.5% |
| Range | 98.3% | 31.5% |
| Mean | 31.6% | 15.5% |
| Median | 20.9% | 15.7% |
| Interquartile 25% (IQ1) | 9.4% | 13.6% |
| Interquartile 75% (IQ3) | 49.4% | 18.9% |
| Interquartile Range (IQR) | 40.0% | 5.3% |
| Standard Deviation (Sample) | 28.8% | 5.2% |
| Standard Deviation (Population) | 28.6% | 5.2% |
Demographics Similar to Native Hawaiians and Immigrants from Colombia by Single Father Poverty
In terms of single father poverty, the demographic groups most similar to Native Hawaiians are Pakistani (15.7%, a difference of 0.010%), Immigrants from Poland (15.7%, a difference of 0.020%), Immigrants from Australia (15.7%, a difference of 0.090%), Australian (15.7%, a difference of 0.10%), and South American Indian (15.7%, a difference of 0.12%). Similarly, the demographic groups most similar to Immigrants from Colombia are Immigrants from Eastern Europe (15.8%, a difference of 0.020%), Immigrants from Argentina (15.8%, a difference of 0.030%), Immigrants from Belarus (15.8%, a difference of 0.030%), Uruguayan (15.9%, a difference of 0.090%), and Immigrants (15.9%, a difference of 0.11%).
| Demographics | Rating | Rank | Single Father Poverty |
| Chileans | 96.4 /100 | #102 | Exceptional 15.7% |
| South American Indians | 96.2 /100 | #103 | Exceptional 15.7% |
| Australians | 96.1 /100 | #104 | Exceptional 15.7% |
| Immigrants | Australia | 96.1 /100 | #105 | Exceptional 15.7% |
| Immigrants | Poland | 95.8 /100 | #106 | Exceptional 15.7% |
| Native Hawaiians | 95.8 /100 | #107 | Exceptional 15.7% |
| Pakistanis | 95.7 /100 | #108 | Exceptional 15.7% |
| Turks | 95.1 /100 | #109 | Exceptional 15.8% |
| Immigrants | Africa | 95.1 /100 | #110 | Exceptional 15.8% |
| Bulgarians | 94.8 /100 | #111 | Exceptional 15.8% |
| Immigrants | Latvia | 94.7 /100 | #112 | Exceptional 15.8% |
| Danes | 94.5 /100 | #113 | Exceptional 15.8% |
| Argentineans | 94.4 /100 | #114 | Exceptional 15.8% |
| Immigrants | Thailand | 93.6 /100 | #115 | Exceptional 15.8% |
| Immigrants | Argentina | 92.8 /100 | #116 | Exceptional 15.8% |
| Immigrants | Colombia | 92.6 /100 | #117 | Exceptional 15.8% |
| Immigrants | Eastern Europe | 92.5 /100 | #118 | Exceptional 15.8% |
| Immigrants | Belarus | 92.4 /100 | #119 | Exceptional 15.8% |
| Uruguayans | 92.1 /100 | #120 | Exceptional 15.9% |
| Immigrants | Immigrants | 91.9 /100 | #121 | Exceptional 15.9% |
| Sudanese | 91.6 /100 | #122 | Exceptional 15.9% |