Native Hawaiian vs Immigrants from Colombia Unemployment Among Seniors over 75 years
COMPARE
Native Hawaiian
Immigrants from Colombia
Unemployment Among Seniors over 75 years
Unemployment Among Seniors over 75 years Comparison
Native Hawaiians
Immigrants from Colombia
8.4%
UNEMPLOYMENT AMONG SENIORS OVER 75 YEARS
96.1/ 100
METRIC RATING
128th/ 347
METRIC RANK
8.5%
UNEMPLOYMENT AMONG SENIORS OVER 75 YEARS
85.6/ 100
METRIC RATING
148th/ 347
METRIC RANK
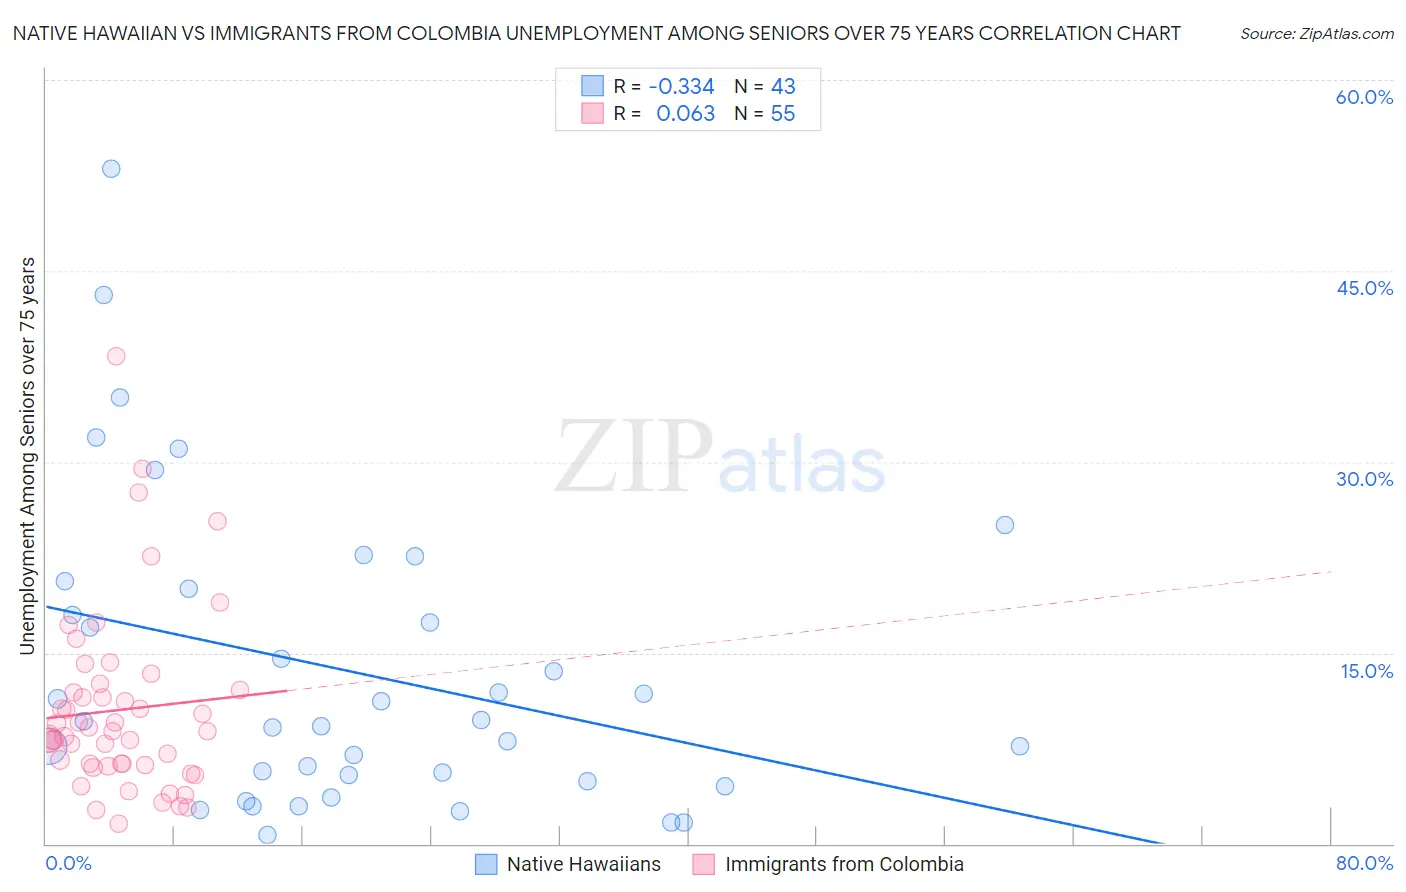
Native Hawaiian vs Immigrants from Colombia Unemployment Among Seniors over 75 years Correlation Chart
The statistical analysis conducted on geographies consisting of 178,636,916 people shows a mild negative correlation between the proportion of Native Hawaiians and unemployment rate among seniors over the age of 75 in the United States with a correlation coefficient (R) of -0.334 and weighted average of 8.4%. Similarly, the statistical analysis conducted on geographies consisting of 196,733,881 people shows a slight positive correlation between the proportion of Immigrants from Colombia and unemployment rate among seniors over the age of 75 in the United States with a correlation coefficient (R) of 0.063 and weighted average of 8.5%, a difference of 2.0%.
Unemployment Among Seniors over 75 years Correlation Summary
| Measurement | Native Hawaiian | Immigrants from Colombia |
| Minimum | 0.70% | 1.6% |
| Maximum | 53.0% | 38.3% |
| Range | 52.3% | 36.7% |
| Mean | 13.6% | 10.5% |
| Median | 9.6% | 8.8% |
| Interquartile 25% (IQ1) | 4.9% | 6.2% |
| Interquartile 75% (IQ3) | 20.0% | 12.1% |
| Interquartile Range (IQR) | 15.1% | 5.9% |
| Standard Deviation (Sample) | 11.9% | 7.1% |
| Standard Deviation (Population) | 11.8% | 7.1% |
Demographics Similar to Native Hawaiians and Immigrants from Colombia by Unemployment Among Seniors over 75 years
In terms of unemployment among seniors over 75 years, the demographic groups most similar to Native Hawaiians are Ghanaian (8.4%, a difference of 0.030%), Apache (8.4%, a difference of 0.31%), German Russian (8.4%, a difference of 0.39%), Chilean (8.4%, a difference of 0.68%), and Serbian (8.4%, a difference of 0.71%). Similarly, the demographic groups most similar to Immigrants from Colombia are Immigrants from Sierra Leone (8.5%, a difference of 0.0%), Immigrants from South Eastern Asia (8.5%, a difference of 0.020%), Immigrants from Romania (8.5%, a difference of 0.070%), Colombian (8.5%, a difference of 0.13%), and Immigrants from Costa Rica (8.5%, a difference of 0.14%).
| Demographics | Rating | Rank | Unemployment Among Seniors over 75 years |
| Native Hawaiians | 96.1 /100 | #128 | Exceptional 8.4% |
| Ghanaians | 96.0 /100 | #129 | Exceptional 8.4% |
| Apache | 95.2 /100 | #130 | Exceptional 8.4% |
| German Russians | 94.9 /100 | #131 | Exceptional 8.4% |
| Chileans | 93.8 /100 | #132 | Exceptional 8.4% |
| Serbians | 93.7 /100 | #133 | Exceptional 8.4% |
| Immigrants | Czechoslovakia | 93.4 /100 | #134 | Exceptional 8.4% |
| Haitians | 91.4 /100 | #135 | Exceptional 8.5% |
| Immigrants | Trinidad and Tobago | 90.8 /100 | #136 | Exceptional 8.5% |
| Immigrants | Kuwait | 90.5 /100 | #137 | Exceptional 8.5% |
| Immigrants | Bulgaria | 89.6 /100 | #138 | Excellent 8.5% |
| Barbadians | 88.6 /100 | #139 | Excellent 8.5% |
| South Americans | 87.9 /100 | #140 | Excellent 8.5% |
| Immigrants | Bolivia | 87.9 /100 | #141 | Excellent 8.5% |
| Immigrants | Ukraine | 87.0 /100 | #142 | Excellent 8.5% |
| Immigrants | Costa Rica | 86.8 /100 | #143 | Excellent 8.5% |
| Colombians | 86.7 /100 | #144 | Excellent 8.5% |
| Immigrants | Romania | 86.2 /100 | #145 | Excellent 8.5% |
| Immigrants | South Eastern Asia | 85.8 /100 | #146 | Excellent 8.5% |
| Immigrants | Sierra Leone | 85.6 /100 | #147 | Excellent 8.5% |
| Immigrants | Colombia | 85.6 /100 | #148 | Excellent 8.5% |