Native Hawaiian vs Immigrants from Colombia Unemployment Among Women with Children Under 18 years

COMPARE

Native Hawaiian
Race
Ancestry
AfghanAfricanAlaska NativeAlaskan AthabascanAlbanianAleutAlsatianAmericanApacheArabArapahoArgentineanArmenianAssyrian/Chaldean/SyriacAustralianAustrianBahamianBangladeshiBarbadianBasqueBelgianBelizeanBermudanBhutaneseBlackfeetBolivianBrazilianBritishBritish West IndianBulgarianBurmeseCajunCambodianCanadianCape VerdeanCarpatho RusynCelticCentral AmericanCentral American IndianCherokeeCheyenneChickasawChileanChineseChippewaChoctawColombianColvilleComancheCosta RicanCreeCreekCroatianCrowCubanCypriotCzechCzechoslovakianDanishDelawareDominicanDutchDutch West IndianEastern EuropeanEcuadorianEgyptianEnglishEstonianEthiopianEuropeanFijianFilipinoFinnishFrenchFrench American IndianFrench CanadianGermanGerman RussianGhanaianGreekGuamanian/ChamorroGuatemalanGuyaneseHaitianHmongHonduranHopiHoumaHungarianIcelanderIndian (Asian)IndonesianInupiatIranianIraqiIrishIroquoisIsraeliItalianJamaicanJapaneseJordanianKenyanKiowaKoreanLaotianLatvianLebaneseLiberianLithuanianLumbeeLuxembourgerMacedonianMalaysianMalteseMarshalleseMenomineeMexicanMexican American IndianMongolianMoroccanNative HawaiianNavajoNepaleseNew ZealanderNicaraguanNigerianNorthern EuropeanNorwegianOkinawanOsageOttawaPaiutePakistaniPalestinianPanamanianParaguayanPennsylvania GermanPeruvianPimaPolishPortuguesePotawatomiPuebloPuerto RicanPuget Sound SalishRomanianRussianSalvadoranSamoanScandinavianScotch-IrishScottishSeminoleSenegaleseSerbianShoshoneSierra LeoneanSiouxSlavicSlovakSloveneSomaliSouth AfricanSouth AmericanSouth American IndianSoviet UnionSpaniardSpanishSpanish AmericanSpanish American IndianSri LankanSubsaharan AfricanSudaneseSwedishSwissSyrianTaiwaneseThaiTlingit-HaidaTohono O'OdhamTonganTrinidadian and TobagonianTsimshianTurkishU.S. Virgin IslanderUgandanUkrainianUruguayanUteVenezuelanVietnameseWelshWest IndianYakamaYaquiYugoslavianYumanYup'ikZimbabwean
Immigration
NonimmigrantsImmigrantsAfghanistanAfricaAlbaniaArgentinaArmeniaAsiaAustraliaAustriaBahamasBangladeshBarbadosBelarusBelgiumBelizeBoliviaBosnia and HerzegovinaBrazilBulgariaBurma/MyanmarCabo VerdeCambodiaCameroonCanadaCaribbeanCentral AmericaChileChinaCongoCosta RicaCroatiaCubaCzechoslovakiaDenmarkDominicaDominican RepublicEastern AfricaEastern AsiaEastern EuropeEcuadorEgyptEl SalvadorEnglandEritreaEthiopiaEuropeFijiFranceGermanyGhanaGreeceGrenadaGuatemalaGuyanaHaitiHondurasHong KongHungaryIndiaIndonesiaIranIraqIrelandIsraelItalyJamaicaJapanJordanKazakhstanKenyaKoreaKuwaitLaosLatin AmericaLatviaLebanonLiberiaLithuaniaMalaysiaMexicoMicronesiaMiddle AfricaMoldovaMoroccoNepalNetherlandsNicaraguaNigeriaNorth AmericaNorth MacedoniaNorthern AfricaNorthern EuropeNorwayOceaniaPakistanPanamaPeruPhilippinesPolandPortugalRomaniaRussiaSaudi ArabiaScotlandSenegalSerbiaSierra LeoneSingaporeSomaliaSouth AfricaSouth AmericaSouth Central AsiaSouth Eastern AsiaSouthern EuropeSpainSri LankaSt. Vincent and the GrenadinesSudanSwedenSwitzerlandSyriaTaiwanThailandTrinidad and TobagoTurkeyUgandaUkraineUruguayUzbekistanVenezuelaVietnamWest IndiesWestern AfricaWestern AsiaWestern EuropeYemenZaireZimbabweAzores
Immigrants from Colombia
Race
Ancestry
AfghanAfricanAlaska NativeAlaskan AthabascanAlbanianAleutAlsatianAmericanApacheArabArapahoArgentineanArmenianAssyrian/Chaldean/SyriacAustralianAustrianBahamianBangladeshiBarbadianBasqueBelgianBelizeanBermudanBhutaneseBlackfeetBolivianBrazilianBritishBritish West IndianBulgarianBurmeseCajunCambodianCanadianCape VerdeanCarpatho RusynCelticCentral AmericanCentral American IndianCherokeeCheyenneChickasawChileanChineseChippewaChoctawColombianColvilleComancheCosta RicanCreeCreekCroatianCrowCubanCypriotCzechCzechoslovakianDanishDelawareDominicanDutchDutch West IndianEastern EuropeanEcuadorianEgyptianEnglishEstonianEthiopianEuropeanFijianFilipinoFinnishFrenchFrench American IndianFrench CanadianGermanGerman RussianGhanaianGreekGuamanian/ChamorroGuatemalanGuyaneseHaitianHmongHonduranHopiHoumaHungarianIcelanderIndian (Asian)IndonesianInupiatIranianIraqiIrishIroquoisIsraeliItalianJamaicanJapaneseJordanianKenyanKiowaKoreanLaotianLatvianLebaneseLiberianLithuanianLumbeeLuxembourgerMacedonianMalaysianMalteseMarshalleseMenomineeMexicanMexican American IndianMongolianMoroccanNavajoNepaleseNew ZealanderNicaraguanNigerianNorthern EuropeanNorwegianOkinawanOsageOttawaPaiutePakistaniPalestinianPanamanianParaguayanPennsylvania GermanPeruvianPimaPolishPortuguesePotawatomiPuebloPuerto RicanPuget Sound SalishRomanianRussianSalvadoranSamoanScandinavianScotch-IrishScottishSeminoleSenegaleseSerbianShoshoneSierra LeoneanSiouxSlavicSlovakSloveneSomaliSouth AfricanSouth AmericanSouth American IndianSoviet UnionSpaniardSpanishSpanish AmericanSpanish American IndianSri LankanSubsaharan AfricanSudaneseSwedishSwissSyrianTaiwaneseThaiTlingit-HaidaTohono O'OdhamTonganTrinidadian and TobagonianTsimshianTurkishU.S. Virgin IslanderUgandanUkrainianUruguayanUteVenezuelanVietnameseWelshWest IndianYakamaYaquiYugoslavianYumanYup'ikZimbabwean
Immigration
NonimmigrantsImmigrantsAfghanistanAfricaAlbaniaArgentinaArmeniaAsiaAustraliaAustriaBahamasBangladeshBarbadosBelarusBelgiumBelizeBoliviaBosnia and HerzegovinaBrazilBulgariaBurma/MyanmarCabo VerdeCambodiaCameroonCanadaCaribbeanCentral AmericaChileChinaColombiaCongoCosta RicaCroatiaCubaCzechoslovakiaDenmarkDominicaDominican RepublicEastern AfricaEastern AsiaEastern EuropeEcuadorEgyptEl SalvadorEnglandEritreaEthiopiaEuropeFijiFranceGermanyGhanaGreeceGrenadaGuatemalaGuyanaHaitiHondurasHong KongHungaryIndiaIndonesiaIranIraqIrelandIsraelItalyJamaicaJapanJordanKazakhstanKenyaKoreaKuwaitLaosLatin AmericaLatviaLebanonLiberiaLithuaniaMalaysiaMexicoMicronesiaMiddle AfricaMoldovaMoroccoNepalNetherlandsNicaraguaNigeriaNorth AmericaNorth MacedoniaNorthern AfricaNorthern EuropeNorwayOceaniaPakistanPanamaPeruPhilippinesPolandPortugalRomaniaRussiaSaudi ArabiaScotlandSenegalSerbiaSierra LeoneSingaporeSomaliaSouth AfricaSouth AmericaSouth Central AsiaSouth Eastern AsiaSouthern EuropeSpainSri LankaSt. Vincent and the GrenadinesSudanSwedenSwitzerlandSyriaTaiwanThailandTrinidad and TobagoTurkeyUgandaUkraineUruguayUzbekistanVenezuelaVietnamWest IndiesWestern AfricaWestern AsiaWestern EuropeYemenZaireZimbabweAzores
Unemployment Among Women with Children Under 18 years
Income
Poverty
Unemployment
Labor Participation
Family Structure
Vehicle Availability
Education Level
Disability

Unemployment Among Women with Children Under 18 years Comparison

Native Hawaiians

Immigrants from Colombia

Excellent
Fair
5.3%
UNEMPLOYMENT AMONG WOMEN WITH CHILDREN UNDER 18 YEARS
84.0/ 100
METRIC RATING
124th/ 347
METRIC RANK
5.6%
UNEMPLOYMENT AMONG WOMEN WITH CHILDREN UNDER 18 YEARS
21.4/ 100
METRIC RATING
197th/ 347
METRIC RANK

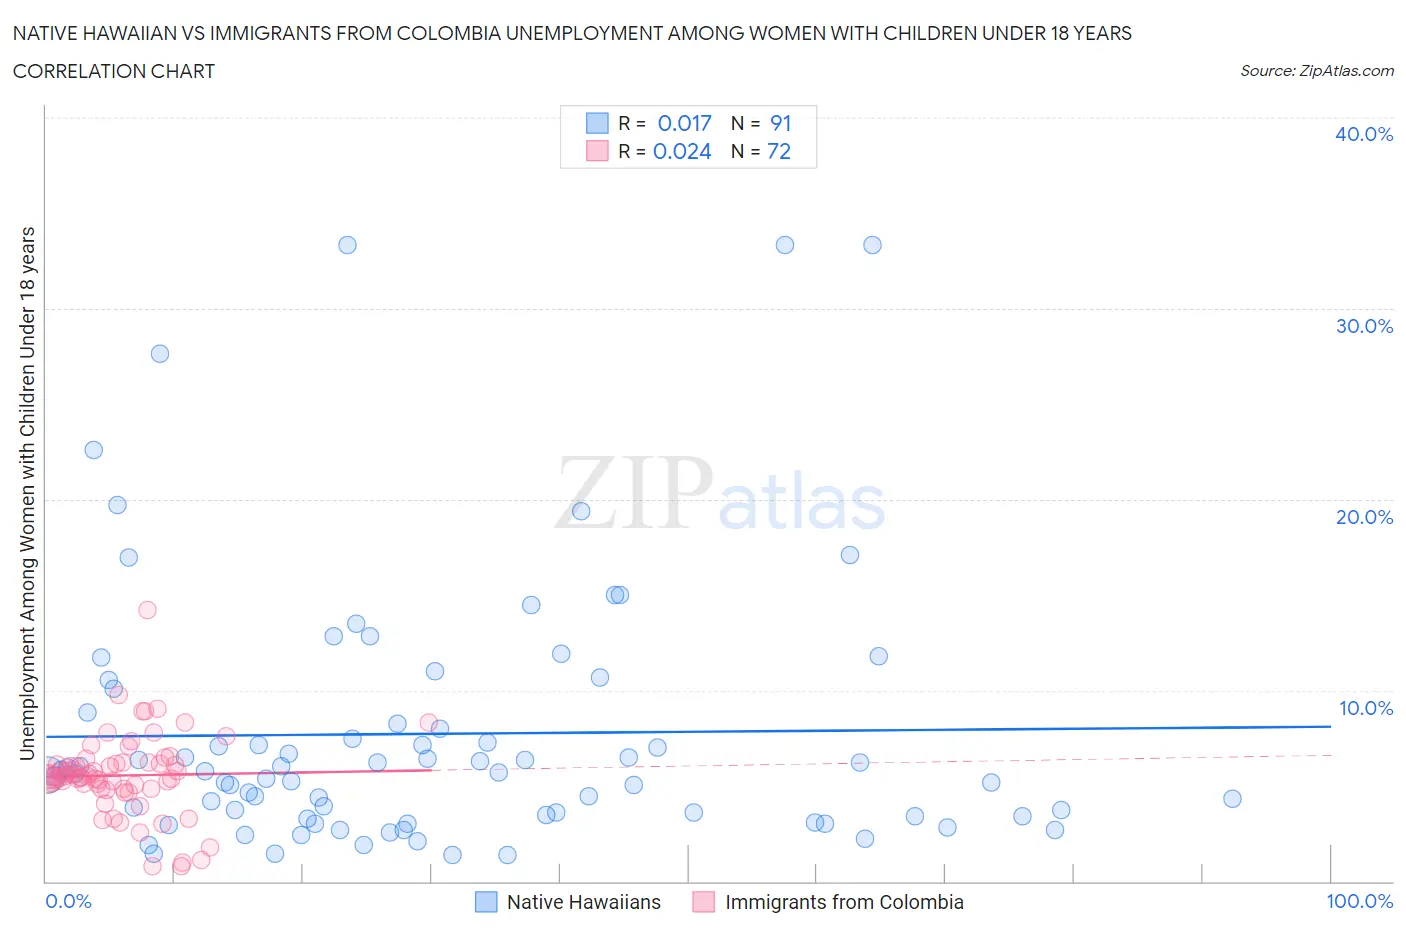
Native Hawaiian vs Immigrants from Colombia Unemployment Among Women with Children Under 18 years Correlation Chart

The statistical analysis conducted on geographies consisting of 320,560,884 people shows no correlation between the proportion of Native Hawaiians and unemployment rate among women with children under the age of 18 in the United States with a correlation coefficient (R) of 0.017 and weighted average of 5.3%. Similarly, the statistical analysis conducted on geographies consisting of 366,462,543 people shows no correlation between the proportion of Immigrants from Colombia and unemployment rate among women with children under the age of 18 in the United States with a correlation coefficient (R) of 0.024 and weighted average of 5.6%, a difference of 5.4%.
Native Hawaiian vs Immigrants from Colombia Unemployment Among Women with Children Under 18 years

Unemployment Among Women with Children Under 18 years Correlation Summary

MeasurementNative HawaiianImmigrants from Colombia
Minimum1.4%0.80%
Maximum33.3%14.2%
Range31.9%13.4%
Mean7.7%5.5%
Median5.7%5.5%
Interquartile 25% (IQ1)3.4%4.9%
Interquartile 75% (IQ3)8.8%6.2%
Interquartile Range (IQR)5.4%1.3%
Standard Deviation (Sample)6.9%2.1%
Standard Deviation (Population)6.8%2.1%

Similar Demographics by Unemployment Among Women with Children Under 18 years

Demographics Similar to Native Hawaiians by Unemployment Among Women with Children Under 18 years

In terms of unemployment among women with children under 18 years, the demographic groups most similar to Native Hawaiians are Sudanese (5.3%, a difference of 0.050%), Immigrants from North Macedonia (5.3%, a difference of 0.11%), Immigrants from Oceania (5.3%, a difference of 0.12%), White/Caucasian (5.3%, a difference of 0.15%), and Immigrants from South Africa (5.3%, a difference of 0.16%).
DemographicsRating | RankUnemployment Among Women with Children Under 18 years
Canadians
87.4
/100
|
#117
Excellent
5.3%
Immigrants | Europe
86.7
/100
|
#118
Excellent
5.3%
Basques
86.5
/100
|
#119
Excellent
5.3%
Egyptians
86.4
/100
|
#120
Excellent
5.3%
Immigrants | Romania
85.8
/100
|
#121
Excellent
5.3%
Scotch-Irish
85.7
/100
|
#122
Excellent
5.3%
Sudanese
84.3
/100
|
#123
Excellent
5.3%
Native Hawaiians
84.0
/100
|
#124
Excellent
5.3%
Immigrants | North Macedonia
83.2
/100
|
#125
Excellent
5.3%
Immigrants | Oceania
83.1
/100
|
#126
Excellent
5.3%
Whites/Caucasians
82.9
/100
|
#127
Excellent
5.3%
Immigrants | South Africa
82.8
/100
|
#128
Excellent
5.3%
Immigrants | Italy
82.3
/100
|
#129
Excellent
5.3%
Immigrants | Austria
82.1
/100
|
#130
Excellent
5.3%
Immigrants | Israel
81.9
/100
|
#131
Excellent
5.3%

Demographics Similar to Immigrants from Colombia by Unemployment Among Women with Children Under 18 years

In terms of unemployment among women with children under 18 years, the demographic groups most similar to Immigrants from Colombia are Arab (5.6%, a difference of 0.0%), Marshallese (5.6%, a difference of 0.13%), Spaniard (5.6%, a difference of 0.14%), Colombian (5.6%, a difference of 0.15%), and Menominee (5.6%, a difference of 0.31%).
DemographicsRating | RankUnemployment Among Women with Children Under 18 years
Immigrants | Poland
31.2
/100
|
#190
Fair
5.5%
South American Indians
30.8
/100
|
#191
Fair
5.5%
Immigrants | Spain
30.7
/100
|
#192
Fair
5.5%
Immigrants | Afghanistan
29.3
/100
|
#193
Fair
5.5%
Immigrants | Chile
29.2
/100
|
#194
Fair
5.5%
Colombians
22.8
/100
|
#195
Fair
5.6%
Spaniards
22.8
/100
|
#196
Fair
5.6%
Immigrants | Colombia
21.4
/100
|
#197
Fair
5.6%
Arabs
21.4
/100
|
#198
Fair
5.6%
Marshallese
20.2
/100
|
#199
Fair
5.6%
Menominee
18.6
/100
|
#200
Poor
5.6%
Immigrants | Morocco
17.9
/100
|
#201
Poor
5.6%
Immigrants | Micronesia
17.1
/100
|
#202
Poor
5.6%
Portuguese
15.9
/100
|
#203
Poor
5.6%
Israelis
15.6
/100
|
#204
Poor
5.6%