Native Hawaiian vs Navajo Single Father Poverty
COMPARE
Native Hawaiian
Navajo
Single Father Poverty
Single Father Poverty Comparison
Native Hawaiians
Navajo
15.7%
SINGLE FATHER POVERTY
95.8/ 100
METRIC RATING
107th/ 347
METRIC RANK
29.2%
SINGLE FATHER POVERTY
0.0/ 100
METRIC RATING
344th/ 347
METRIC RANK
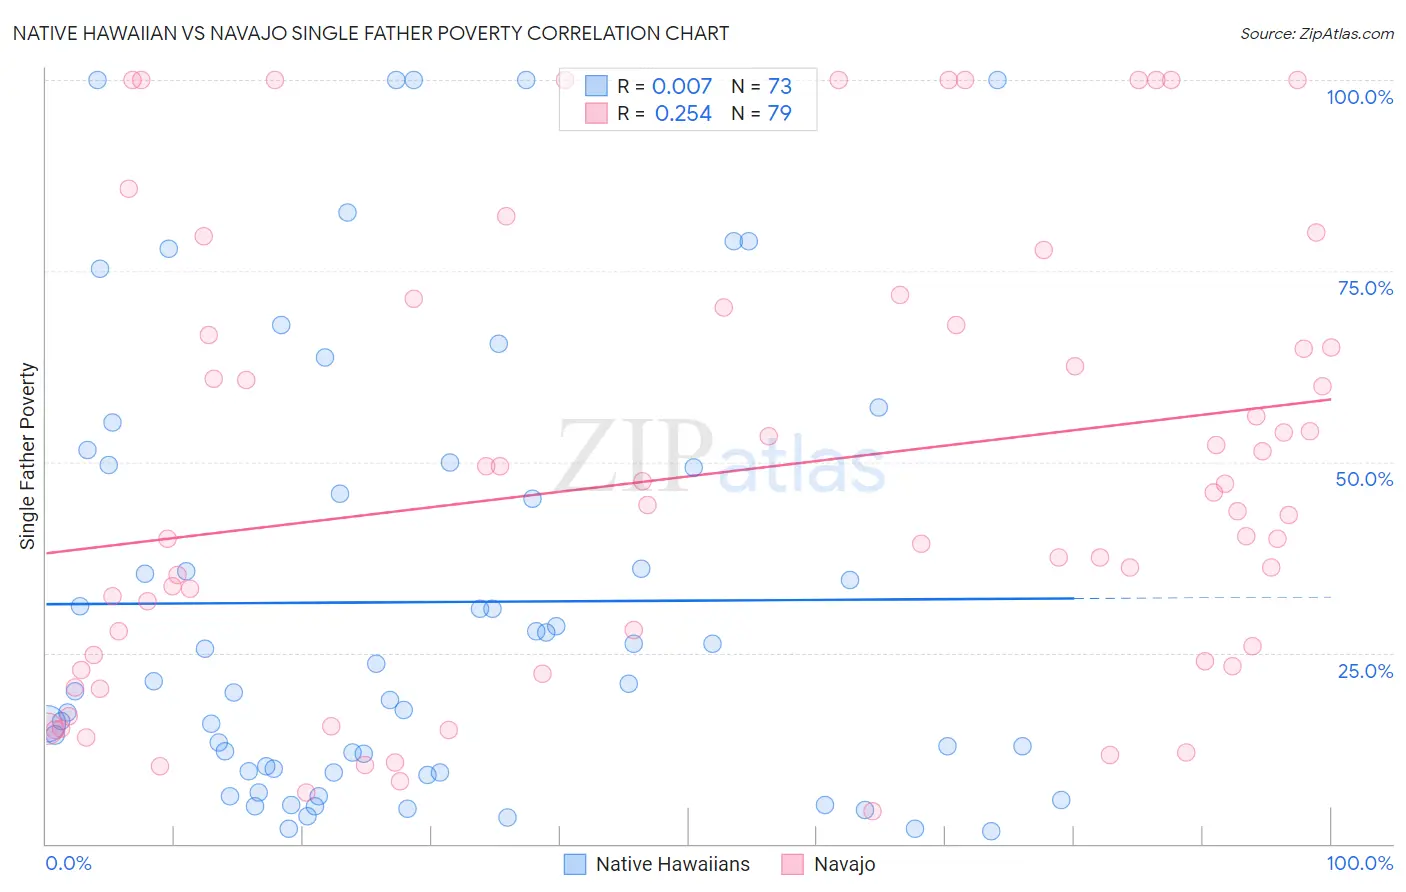
Native Hawaiian vs Navajo Single Father Poverty Correlation Chart
The statistical analysis conducted on geographies consisting of 273,491,221 people shows no correlation between the proportion of Native Hawaiians and poverty level among single fathers in the United States with a correlation coefficient (R) of 0.007 and weighted average of 15.7%. Similarly, the statistical analysis conducted on geographies consisting of 195,813,521 people shows a weak positive correlation between the proportion of Navajo and poverty level among single fathers in the United States with a correlation coefficient (R) of 0.254 and weighted average of 29.2%, a difference of 85.8%.
Single Father Poverty Correlation Summary
| Measurement | Native Hawaiian | Navajo |
| Minimum | 1.7% | 4.3% |
| Maximum | 100.0% | 100.0% |
| Range | 98.3% | 95.7% |
| Mean | 31.6% | 48.2% |
| Median | 20.9% | 43.6% |
| Interquartile 25% (IQ1) | 9.4% | 23.3% |
| Interquartile 75% (IQ3) | 49.4% | 67.9% |
| Interquartile Range (IQR) | 40.0% | 44.6% |
| Standard Deviation (Sample) | 28.8% | 29.2% |
| Standard Deviation (Population) | 28.6% | 29.0% |
Similar Demographics by Single Father Poverty
Demographics Similar to Native Hawaiians by Single Father Poverty
In terms of single father poverty, the demographic groups most similar to Native Hawaiians are Pakistani (15.7%, a difference of 0.010%), Immigrants from Poland (15.7%, a difference of 0.020%), Immigrants from Australia (15.7%, a difference of 0.090%), Australian (15.7%, a difference of 0.10%), and South American Indian (15.7%, a difference of 0.12%).
| Demographics | Rating | Rank | Single Father Poverty |
| Immigrants | Chile | 96.9 /100 | #100 | Exceptional 15.7% |
| Fijians | 96.8 /100 | #101 | Exceptional 15.7% |
| Chileans | 96.4 /100 | #102 | Exceptional 15.7% |
| South American Indians | 96.2 /100 | #103 | Exceptional 15.7% |
| Australians | 96.1 /100 | #104 | Exceptional 15.7% |
| Immigrants | Australia | 96.1 /100 | #105 | Exceptional 15.7% |
| Immigrants | Poland | 95.8 /100 | #106 | Exceptional 15.7% |
| Native Hawaiians | 95.8 /100 | #107 | Exceptional 15.7% |
| Pakistanis | 95.7 /100 | #108 | Exceptional 15.7% |
| Turks | 95.1 /100 | #109 | Exceptional 15.8% |
| Immigrants | Africa | 95.1 /100 | #110 | Exceptional 15.8% |
| Bulgarians | 94.8 /100 | #111 | Exceptional 15.8% |
| Immigrants | Latvia | 94.7 /100 | #112 | Exceptional 15.8% |
| Danes | 94.5 /100 | #113 | Exceptional 15.8% |
| Argentineans | 94.4 /100 | #114 | Exceptional 15.8% |
Demographics Similar to Navajo by Single Father Poverty
In terms of single father poverty, the demographic groups most similar to Navajo are Lumbee (28.5%, a difference of 2.6%), Yuman (28.4%, a difference of 2.9%), Crow (30.3%, a difference of 3.6%), Hopi (27.2%, a difference of 7.6%), and Puerto Rican (31.5%, a difference of 7.9%).
| Demographics | Rating | Rank | Single Father Poverty |
| Natives/Alaskans | 0.0 /100 | #333 | Tragic 22.4% |
| Kiowa | 0.0 /100 | #334 | Tragic 22.5% |
| Shoshone | 0.0 /100 | #335 | Tragic 22.9% |
| Cajuns | 0.0 /100 | #336 | Tragic 23.1% |
| Sioux | 0.0 /100 | #337 | Tragic 23.9% |
| Arapaho | 0.0 /100 | #338 | Tragic 24.0% |
| Apache | 0.0 /100 | #339 | Tragic 24.2% |
| Houma | 0.0 /100 | #340 | Tragic 26.7% |
| Hopi | 0.0 /100 | #341 | Tragic 27.2% |
| Yuman | 0.0 /100 | #342 | Tragic 28.4% |
| Lumbee | 0.0 /100 | #343 | Tragic 28.5% |
| Navajo | 0.0 /100 | #344 | Tragic 29.2% |
| Crow | 0.0 /100 | #345 | Tragic 30.3% |
| Puerto Ricans | 0.0 /100 | #346 | Tragic 31.5% |
| Yup'ik | 0.0 /100 | #347 | Tragic 32.5% |