Native Hawaiian vs Immigrants from North Macedonia Single Male Poverty
COMPARE
Native Hawaiian
Immigrants from North Macedonia
Single Male Poverty
Single Male Poverty Comparison
Native Hawaiians
Immigrants from North Macedonia
12.6%
SINGLE MALE POVERTY
75.0/ 100
METRIC RATING
146th/ 347
METRIC RANK
12.3%
SINGLE MALE POVERTY
93.6/ 100
METRIC RATING
111th/ 347
METRIC RANK
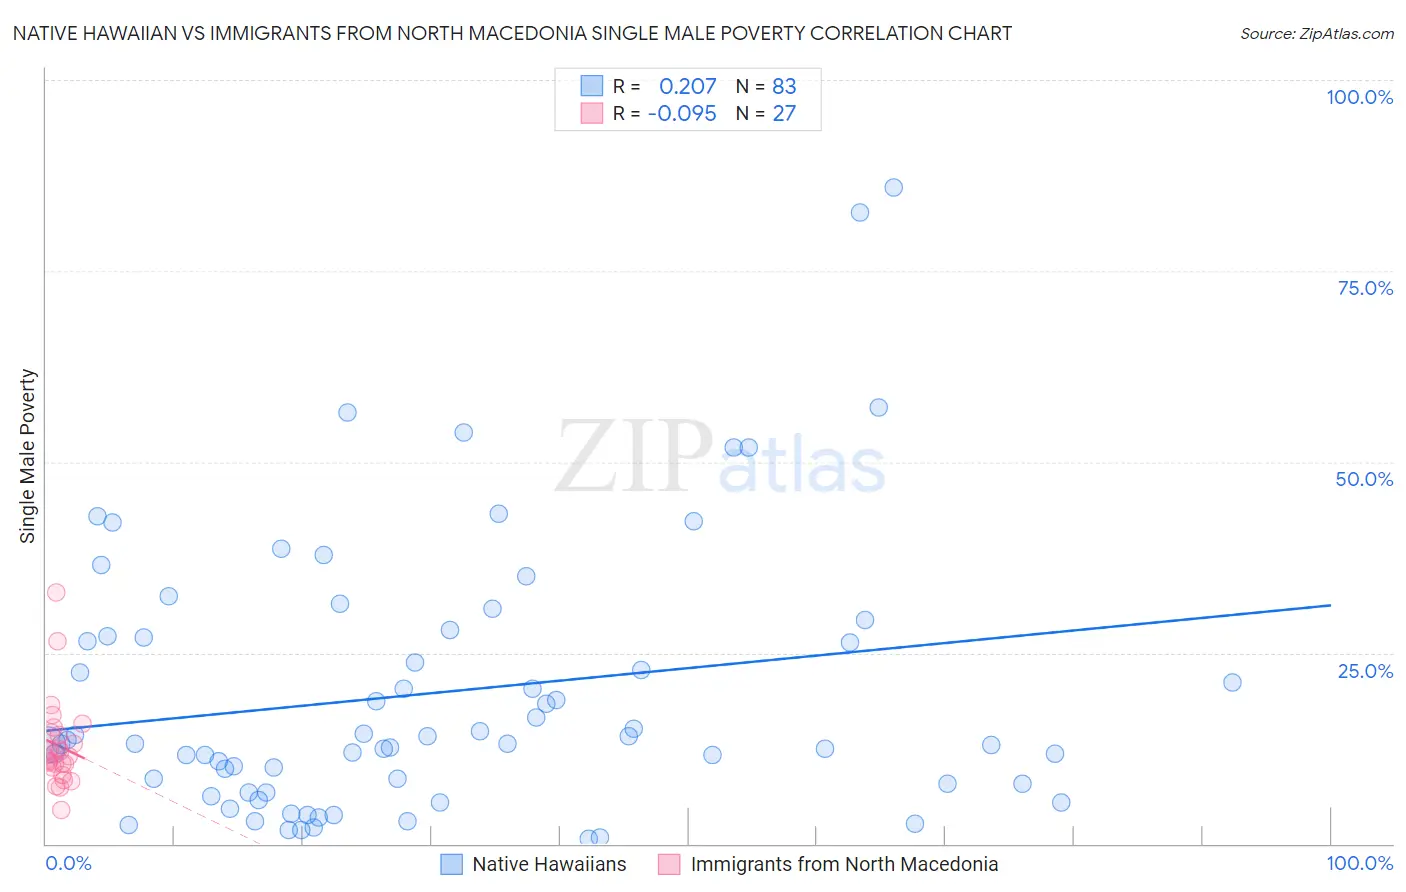
Native Hawaiian vs Immigrants from North Macedonia Single Male Poverty Correlation Chart
The statistical analysis conducted on geographies consisting of 302,802,945 people shows a weak positive correlation between the proportion of Native Hawaiians and poverty level among single males in the United States with a correlation coefficient (R) of 0.207 and weighted average of 12.6%. Similarly, the statistical analysis conducted on geographies consisting of 69,458,947 people shows a slight negative correlation between the proportion of Immigrants from North Macedonia and poverty level among single males in the United States with a correlation coefficient (R) of -0.095 and weighted average of 12.3%, a difference of 2.2%.
Single Male Poverty Correlation Summary
| Measurement | Native Hawaiian | Immigrants from North Macedonia |
| Minimum | 0.72% | 4.5% |
| Maximum | 86.0% | 32.9% |
| Range | 85.3% | 28.4% |
| Mean | 19.8% | 12.8% |
| Median | 13.1% | 11.4% |
| Interquartile 25% (IQ1) | 7.9% | 10.0% |
| Interquartile 75% (IQ3) | 27.2% | 14.6% |
| Interquartile Range (IQR) | 19.3% | 4.6% |
| Standard Deviation (Sample) | 17.6% | 5.8% |
| Standard Deviation (Population) | 17.5% | 5.7% |
Similar Demographics by Single Male Poverty
Demographics Similar to Native Hawaiians by Single Male Poverty
In terms of single male poverty, the demographic groups most similar to Native Hawaiians are Immigrants from Lebanon (12.6%, a difference of 0.0%), Hawaiian (12.6%, a difference of 0.010%), Malaysian (12.6%, a difference of 0.010%), Immigrants from France (12.6%, a difference of 0.060%), and Okinawan (12.6%, a difference of 0.070%).
| Demographics | Rating | Rank | Single Male Poverty |
| Cubans | 79.9 /100 | #139 | Good 12.6% |
| Immigrants | Zimbabwe | 78.0 /100 | #140 | Good 12.6% |
| Okinawans | 75.9 /100 | #141 | Good 12.6% |
| Immigrants | Uganda | 75.9 /100 | #142 | Good 12.6% |
| Immigrants | France | 75.8 /100 | #143 | Good 12.6% |
| Hawaiians | 75.1 /100 | #144 | Good 12.6% |
| Immigrants | Lebanon | 75.0 /100 | #145 | Good 12.6% |
| Native Hawaiians | 75.0 /100 | #146 | Good 12.6% |
| Malaysians | 74.8 /100 | #147 | Good 12.6% |
| Yugoslavians | 73.9 /100 | #148 | Good 12.6% |
| Sierra Leoneans | 73.0 /100 | #149 | Good 12.6% |
| Immigrants | Panama | 72.1 /100 | #150 | Good 12.6% |
| Immigrants | Hungary | 71.9 /100 | #151 | Good 12.6% |
| Australians | 71.4 /100 | #152 | Good 12.6% |
| Immigrants | Immigrants | 70.1 /100 | #153 | Good 12.7% |
Demographics Similar to Immigrants from North Macedonia by Single Male Poverty
In terms of single male poverty, the demographic groups most similar to Immigrants from North Macedonia are Immigrants from Portugal (12.3%, a difference of 0.010%), Kenyan (12.4%, a difference of 0.060%), Ugandan (12.3%, a difference of 0.24%), Pakistani (12.4%, a difference of 0.25%), and Nicaraguan (12.4%, a difference of 0.30%).
| Demographics | Rating | Rank | Single Male Poverty |
| Immigrants | Kazakhstan | 96.7 /100 | #104 | Exceptional 12.2% |
| Jordanians | 95.9 /100 | #105 | Exceptional 12.3% |
| Immigrants | Morocco | 95.6 /100 | #106 | Exceptional 12.3% |
| Iraqis | 95.1 /100 | #107 | Exceptional 12.3% |
| Immigrants | Eastern Africa | 95.0 /100 | #108 | Exceptional 12.3% |
| Ugandans | 94.5 /100 | #109 | Exceptional 12.3% |
| Immigrants | Portugal | 93.6 /100 | #110 | Exceptional 12.3% |
| Immigrants | North Macedonia | 93.6 /100 | #111 | Exceptional 12.3% |
| Kenyans | 93.3 /100 | #112 | Exceptional 12.4% |
| Pakistanis | 92.4 /100 | #113 | Exceptional 12.4% |
| Nicaraguans | 92.1 /100 | #114 | Exceptional 12.4% |
| Immigrants | Southern Europe | 91.5 /100 | #115 | Exceptional 12.4% |
| Immigrants | Syria | 91.2 /100 | #116 | Exceptional 12.4% |
| Immigrants | Oceania | 91.1 /100 | #117 | Exceptional 12.4% |
| Albanians | 90.6 /100 | #118 | Exceptional 12.4% |