Moroccan vs Immigrants from Mexico Female Poverty Among 25-34 Year Olds
COMPARE
Moroccan
Immigrants from Mexico
Female Poverty Among 25-34 Year Olds
Female Poverty Among 25-34 Year Olds Comparison
Moroccans
Immigrants from Mexico
13.8%
FEMALE POVERTY AMONG 25-34 YEAR OLDS
25.1/ 100
METRIC RATING
194th/ 347
METRIC RANK
16.8%
FEMALE POVERTY AMONG 25-34 YEAR OLDS
0.0/ 100
METRIC RATING
303rd/ 347
METRIC RANK
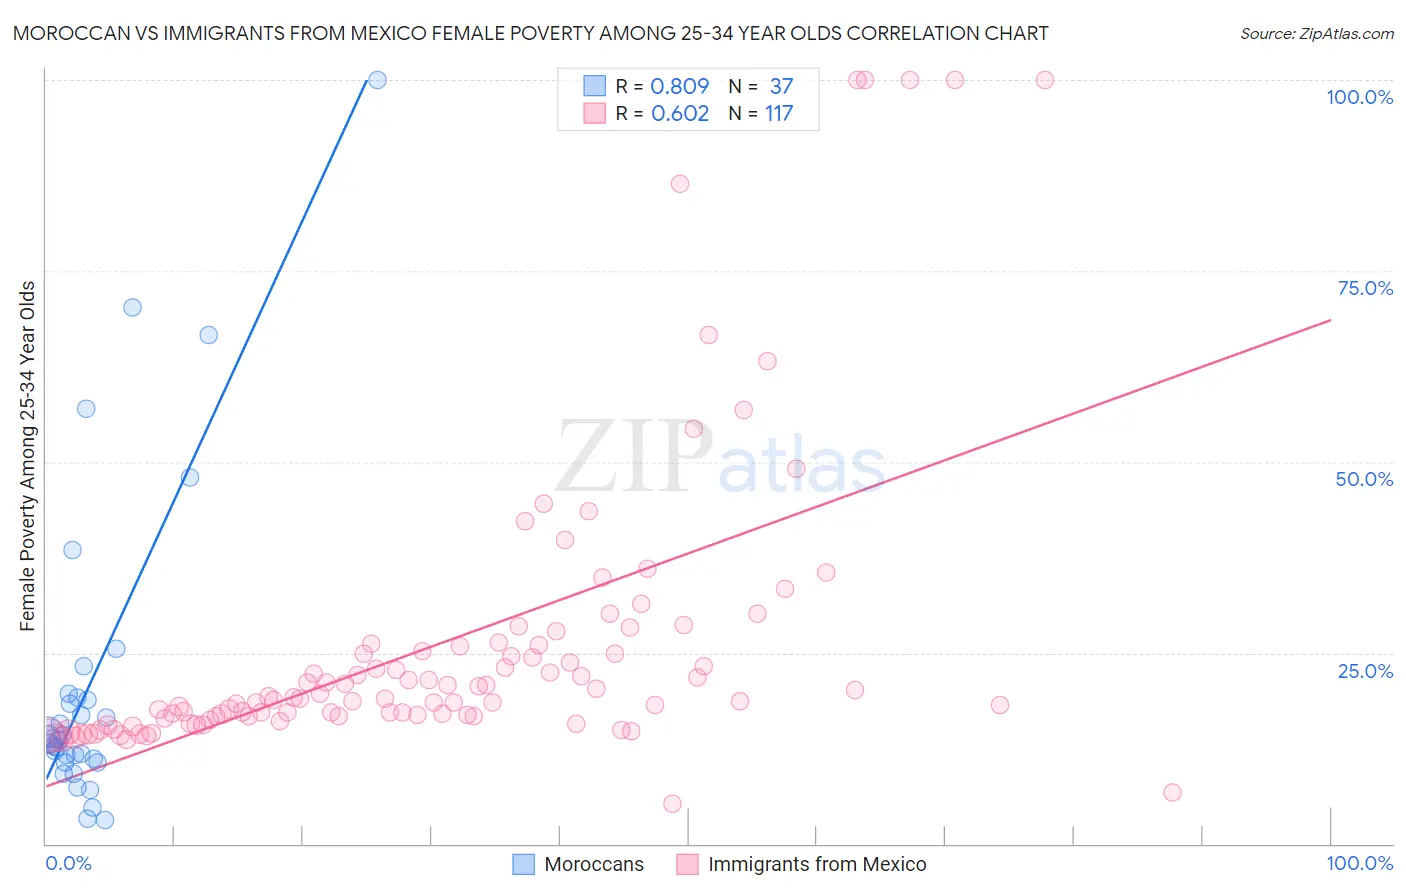
Moroccan vs Immigrants from Mexico Female Poverty Among 25-34 Year Olds Correlation Chart
The statistical analysis conducted on geographies consisting of 200,251,760 people shows a very strong positive correlation between the proportion of Moroccans and poverty level among females between the ages 25 and 34 in the United States with a correlation coefficient (R) of 0.809 and weighted average of 13.8%. Similarly, the statistical analysis conducted on geographies consisting of 502,193,205 people shows a significant positive correlation between the proportion of Immigrants from Mexico and poverty level among females between the ages 25 and 34 in the United States with a correlation coefficient (R) of 0.602 and weighted average of 16.8%, a difference of 21.5%.
Female Poverty Among 25-34 Year Olds Correlation Summary
| Measurement | Moroccan | Immigrants from Mexico |
| Minimum | 3.1% | 5.3% |
| Maximum | 100.0% | 100.0% |
| Range | 96.9% | 94.7% |
| Mean | 21.2% | 26.1% |
| Median | 13.8% | 19.0% |
| Interquartile 25% (IQ1) | 10.9% | 16.7% |
| Interquartile 75% (IQ3) | 19.4% | 25.9% |
| Interquartile Range (IQR) | 8.6% | 9.2% |
| Standard Deviation (Sample) | 21.0% | 19.6% |
| Standard Deviation (Population) | 20.7% | 19.5% |
Similar Demographics by Female Poverty Among 25-34 Year Olds
Demographics Similar to Moroccans by Female Poverty Among 25-34 Year Olds
In terms of female poverty among 25-34 year olds, the demographic groups most similar to Moroccans are Immigrants from Cambodia (13.9%, a difference of 0.11%), Scottish (13.9%, a difference of 0.16%), Immigrants from Kenya (13.8%, a difference of 0.31%), Tlingit-Haida (13.8%, a difference of 0.32%), and Immigrants from Saudi Arabia (13.9%, a difference of 0.36%).
| Demographics | Rating | Rank | Female Poverty Among 25-34 Year Olds |
| Slovaks | 34.1 /100 | #187 | Fair 13.7% |
| Immigrants | Eritrea | 32.7 /100 | #188 | Fair 13.7% |
| Finns | 32.5 /100 | #189 | Fair 13.7% |
| Dutch | 29.7 /100 | #190 | Fair 13.8% |
| Immigrants | St. Vincent and the Grenadines | 29.3 /100 | #191 | Fair 13.8% |
| Tlingit-Haida | 28.1 /100 | #192 | Fair 13.8% |
| Immigrants | Kenya | 28.0 /100 | #193 | Fair 13.8% |
| Moroccans | 25.1 /100 | #194 | Fair 13.8% |
| Immigrants | Cambodia | 24.0 /100 | #195 | Fair 13.9% |
| Scottish | 23.6 /100 | #196 | Fair 13.9% |
| Immigrants | Saudi Arabia | 21.9 /100 | #197 | Fair 13.9% |
| Immigrants | Germany | 20.9 /100 | #198 | Fair 13.9% |
| English | 20.4 /100 | #199 | Fair 13.9% |
| Hmong | 20.3 /100 | #200 | Fair 13.9% |
| Immigrants | Trinidad and Tobago | 17.6 /100 | #201 | Poor 14.0% |
Demographics Similar to Immigrants from Mexico by Female Poverty Among 25-34 Year Olds
In terms of female poverty among 25-34 year olds, the demographic groups most similar to Immigrants from Mexico are Alaska Native (16.8%, a difference of 0.31%), Honduran (16.9%, a difference of 0.42%), Immigrants from Congo (16.7%, a difference of 0.43%), U.S. Virgin Islander (16.7%, a difference of 0.44%), and Spanish American (16.7%, a difference of 0.58%).
| Demographics | Rating | Rank | Female Poverty Among 25-34 Year Olds |
| Hispanics or Latinos | 0.0 /100 | #296 | Tragic 16.6% |
| Immigrants | Guatemala | 0.0 /100 | #297 | Tragic 16.6% |
| Blackfeet | 0.0 /100 | #298 | Tragic 16.7% |
| Spanish Americans | 0.0 /100 | #299 | Tragic 16.7% |
| U.S. Virgin Islanders | 0.0 /100 | #300 | Tragic 16.7% |
| Immigrants | Congo | 0.0 /100 | #301 | Tragic 16.7% |
| Alaska Natives | 0.0 /100 | #302 | Tragic 16.8% |
| Immigrants | Mexico | 0.0 /100 | #303 | Tragic 16.8% |
| Hondurans | 0.0 /100 | #304 | Tragic 16.9% |
| Immigrants | Cabo Verde | 0.0 /100 | #305 | Tragic 16.9% |
| Chickasaw | 0.0 /100 | #306 | Tragic 17.0% |
| Yaqui | 0.0 /100 | #307 | Tragic 17.0% |
| Africans | 0.0 /100 | #308 | Tragic 17.0% |
| Ottawa | 0.0 /100 | #309 | Tragic 17.1% |
| Cherokee | 0.0 /100 | #310 | Tragic 17.2% |