Moroccan vs Shoshone Female Poverty Among 25-34 Year Olds
COMPARE
Moroccan
Shoshone
Female Poverty Among 25-34 Year Olds
Female Poverty Among 25-34 Year Olds Comparison
Moroccans
Shoshone
13.8%
FEMALE POVERTY AMONG 25-34 YEAR OLDS
25.1/ 100
METRIC RATING
194th/ 347
METRIC RANK
16.2%
FEMALE POVERTY AMONG 25-34 YEAR OLDS
0.0/ 100
METRIC RATING
284th/ 347
METRIC RANK
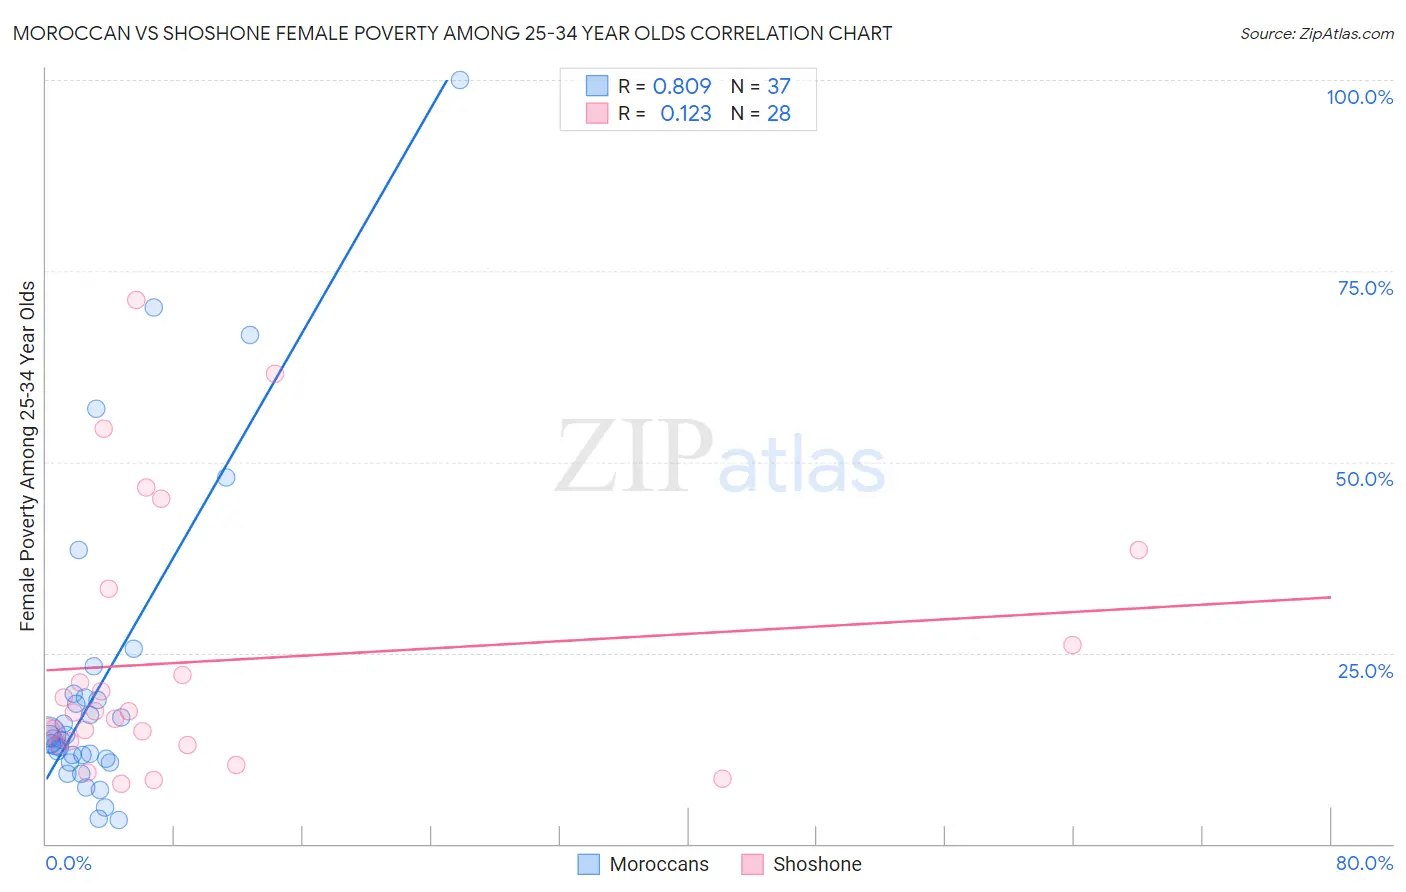
Moroccan vs Shoshone Female Poverty Among 25-34 Year Olds Correlation Chart
The statistical analysis conducted on geographies consisting of 200,251,760 people shows a very strong positive correlation between the proportion of Moroccans and poverty level among females between the ages 25 and 34 in the United States with a correlation coefficient (R) of 0.809 and weighted average of 13.8%. Similarly, the statistical analysis conducted on geographies consisting of 66,384,090 people shows a poor positive correlation between the proportion of Shoshone and poverty level among females between the ages 25 and 34 in the United States with a correlation coefficient (R) of 0.123 and weighted average of 16.2%, a difference of 17.3%.
Female Poverty Among 25-34 Year Olds Correlation Summary
| Measurement | Moroccan | Shoshone |
| Minimum | 3.1% | 7.9% |
| Maximum | 100.0% | 71.1% |
| Range | 96.9% | 63.3% |
| Mean | 21.2% | 24.0% |
| Median | 13.8% | 17.3% |
| Interquartile 25% (IQ1) | 10.9% | 13.1% |
| Interquartile 75% (IQ3) | 19.4% | 29.7% |
| Interquartile Range (IQR) | 8.6% | 16.6% |
| Standard Deviation (Sample) | 21.0% | 17.1% |
| Standard Deviation (Population) | 20.7% | 16.8% |
Similar Demographics by Female Poverty Among 25-34 Year Olds
Demographics Similar to Moroccans by Female Poverty Among 25-34 Year Olds
In terms of female poverty among 25-34 year olds, the demographic groups most similar to Moroccans are Immigrants from Cambodia (13.9%, a difference of 0.11%), Scottish (13.9%, a difference of 0.16%), Immigrants from Kenya (13.8%, a difference of 0.31%), Tlingit-Haida (13.8%, a difference of 0.32%), and Immigrants from Saudi Arabia (13.9%, a difference of 0.36%).
| Demographics | Rating | Rank | Female Poverty Among 25-34 Year Olds |
| Slovaks | 34.1 /100 | #187 | Fair 13.7% |
| Immigrants | Eritrea | 32.7 /100 | #188 | Fair 13.7% |
| Finns | 32.5 /100 | #189 | Fair 13.7% |
| Dutch | 29.7 /100 | #190 | Fair 13.8% |
| Immigrants | St. Vincent and the Grenadines | 29.3 /100 | #191 | Fair 13.8% |
| Tlingit-Haida | 28.1 /100 | #192 | Fair 13.8% |
| Immigrants | Kenya | 28.0 /100 | #193 | Fair 13.8% |
| Moroccans | 25.1 /100 | #194 | Fair 13.8% |
| Immigrants | Cambodia | 24.0 /100 | #195 | Fair 13.9% |
| Scottish | 23.6 /100 | #196 | Fair 13.9% |
| Immigrants | Saudi Arabia | 21.9 /100 | #197 | Fair 13.9% |
| Immigrants | Germany | 20.9 /100 | #198 | Fair 13.9% |
| English | 20.4 /100 | #199 | Fair 13.9% |
| Hmong | 20.3 /100 | #200 | Fair 13.9% |
| Immigrants | Trinidad and Tobago | 17.6 /100 | #201 | Poor 14.0% |
Demographics Similar to Shoshone by Female Poverty Among 25-34 Year Olds
In terms of female poverty among 25-34 year olds, the demographic groups most similar to Shoshone are Immigrants from Bahamas (16.3%, a difference of 0.50%), Cape Verdean (16.3%, a difference of 0.68%), American (16.4%, a difference of 0.73%), Bahamian (16.1%, a difference of 0.83%), and Aleut (16.1%, a difference of 0.87%).
| Demographics | Rating | Rank | Female Poverty Among 25-34 Year Olds |
| Immigrants | Micronesia | 0.0 /100 | #277 | Tragic 15.8% |
| French American Indians | 0.0 /100 | #278 | Tragic 15.9% |
| Fijians | 0.0 /100 | #279 | Tragic 15.9% |
| Bangladeshis | 0.0 /100 | #280 | Tragic 15.9% |
| Immigrants | Latin America | 0.0 /100 | #281 | Tragic 16.0% |
| Aleuts | 0.0 /100 | #282 | Tragic 16.1% |
| Bahamians | 0.0 /100 | #283 | Tragic 16.1% |
| Shoshone | 0.0 /100 | #284 | Tragic 16.2% |
| Immigrants | Bahamas | 0.0 /100 | #285 | Tragic 16.3% |
| Cape Verdeans | 0.0 /100 | #286 | Tragic 16.3% |
| Americans | 0.0 /100 | #287 | Tragic 16.4% |
| Guatemalans | 0.0 /100 | #288 | Tragic 16.4% |
| Osage | 0.0 /100 | #289 | Tragic 16.4% |
| Indonesians | 0.0 /100 | #290 | Tragic 16.4% |
| Comanche | 0.0 /100 | #291 | Tragic 16.5% |