Barbadian vs Immigrants from Mexico Female Poverty Among 25-34 Year Olds
COMPARE
Barbadian
Immigrants from Mexico
Female Poverty Among 25-34 Year Olds
Female Poverty Among 25-34 Year Olds Comparison
Barbadians
Immigrants from Mexico
14.8%
FEMALE POVERTY AMONG 25-34 YEAR OLDS
1.2/ 100
METRIC RATING
242nd/ 347
METRIC RANK
16.8%
FEMALE POVERTY AMONG 25-34 YEAR OLDS
0.0/ 100
METRIC RATING
303rd/ 347
METRIC RANK
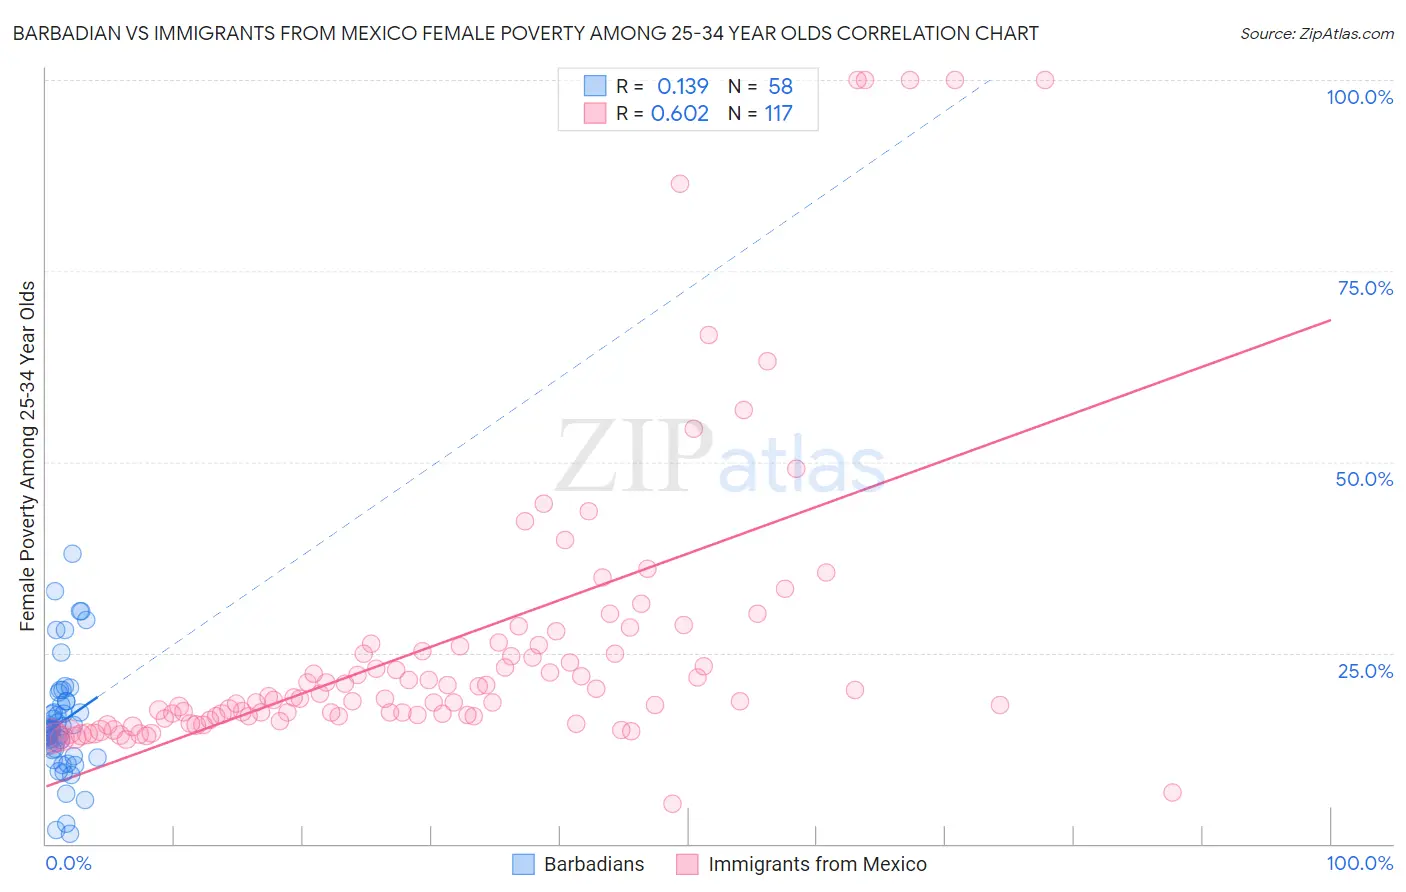
Barbadian vs Immigrants from Mexico Female Poverty Among 25-34 Year Olds Correlation Chart
The statistical analysis conducted on geographies consisting of 140,596,160 people shows a poor positive correlation between the proportion of Barbadians and poverty level among females between the ages 25 and 34 in the United States with a correlation coefficient (R) of 0.139 and weighted average of 14.8%. Similarly, the statistical analysis conducted on geographies consisting of 502,193,205 people shows a significant positive correlation between the proportion of Immigrants from Mexico and poverty level among females between the ages 25 and 34 in the United States with a correlation coefficient (R) of 0.602 and weighted average of 16.8%, a difference of 13.8%.
Female Poverty Among 25-34 Year Olds Correlation Summary
| Measurement | Barbadian | Immigrants from Mexico |
| Minimum | 1.4% | 5.3% |
| Maximum | 37.9% | 100.0% |
| Range | 36.5% | 94.7% |
| Mean | 16.0% | 26.1% |
| Median | 14.9% | 19.0% |
| Interquartile 25% (IQ1) | 12.3% | 16.7% |
| Interquartile 75% (IQ3) | 18.7% | 25.9% |
| Interquartile Range (IQR) | 6.4% | 9.2% |
| Standard Deviation (Sample) | 7.3% | 19.6% |
| Standard Deviation (Population) | 7.2% | 19.5% |
Similar Demographics by Female Poverty Among 25-34 Year Olds
Demographics Similar to Barbadians by Female Poverty Among 25-34 Year Olds
In terms of female poverty among 25-34 year olds, the demographic groups most similar to Barbadians are Scotch-Irish (14.8%, a difference of 0.0%), Immigrants from Nicaragua (14.8%, a difference of 0.040%), Immigrants from Bangladesh (14.8%, a difference of 0.040%), Immigrants from Middle Africa (14.8%, a difference of 0.22%), and Immigrants from Grenada (14.7%, a difference of 0.26%).
| Demographics | Rating | Rank | Female Poverty Among 25-34 Year Olds |
| Immigrants | Jamaica | 1.4 /100 | #235 | Tragic 14.7% |
| Salvadorans | 1.4 /100 | #236 | Tragic 14.7% |
| Immigrants | Ghana | 1.4 /100 | #237 | Tragic 14.7% |
| Alsatians | 1.4 /100 | #238 | Tragic 14.7% |
| Malaysians | 1.4 /100 | #239 | Tragic 14.7% |
| Immigrants | Grenada | 1.3 /100 | #240 | Tragic 14.7% |
| Scotch-Irish | 1.2 /100 | #241 | Tragic 14.8% |
| Barbadians | 1.2 /100 | #242 | Tragic 14.8% |
| Immigrants | Nicaragua | 1.1 /100 | #243 | Tragic 14.8% |
| Immigrants | Bangladesh | 1.1 /100 | #244 | Tragic 14.8% |
| Immigrants | Middle Africa | 1.0 /100 | #245 | Tragic 14.8% |
| Jamaicans | 1.0 /100 | #246 | Tragic 14.8% |
| German Russians | 0.8 /100 | #247 | Tragic 14.9% |
| Immigrants | Western Africa | 0.8 /100 | #248 | Tragic 14.9% |
| Immigrants | Haiti | 0.5 /100 | #249 | Tragic 15.0% |
Demographics Similar to Immigrants from Mexico by Female Poverty Among 25-34 Year Olds
In terms of female poverty among 25-34 year olds, the demographic groups most similar to Immigrants from Mexico are Alaska Native (16.8%, a difference of 0.31%), Honduran (16.9%, a difference of 0.42%), Immigrants from Congo (16.7%, a difference of 0.43%), U.S. Virgin Islander (16.7%, a difference of 0.44%), and Spanish American (16.7%, a difference of 0.58%).
| Demographics | Rating | Rank | Female Poverty Among 25-34 Year Olds |
| Hispanics or Latinos | 0.0 /100 | #296 | Tragic 16.6% |
| Immigrants | Guatemala | 0.0 /100 | #297 | Tragic 16.6% |
| Blackfeet | 0.0 /100 | #298 | Tragic 16.7% |
| Spanish Americans | 0.0 /100 | #299 | Tragic 16.7% |
| U.S. Virgin Islanders | 0.0 /100 | #300 | Tragic 16.7% |
| Immigrants | Congo | 0.0 /100 | #301 | Tragic 16.7% |
| Alaska Natives | 0.0 /100 | #302 | Tragic 16.8% |
| Immigrants | Mexico | 0.0 /100 | #303 | Tragic 16.8% |
| Hondurans | 0.0 /100 | #304 | Tragic 16.9% |
| Immigrants | Cabo Verde | 0.0 /100 | #305 | Tragic 16.9% |
| Chickasaw | 0.0 /100 | #306 | Tragic 17.0% |
| Yaqui | 0.0 /100 | #307 | Tragic 17.0% |
| Africans | 0.0 /100 | #308 | Tragic 17.0% |
| Ottawa | 0.0 /100 | #309 | Tragic 17.1% |
| Cherokee | 0.0 /100 | #310 | Tragic 17.2% |