Moroccan vs Immigrants from Cameroon Poverty
COMPARE
Moroccan
Immigrants from Cameroon
Poverty
Poverty Comparison
Moroccans
Immigrants from Cameroon
13.2%
POVERTY
5.2/ 100
METRIC RATING
211th/ 347
METRIC RANK
12.4%
POVERTY
41.7/ 100
METRIC RATING
182nd/ 347
METRIC RANK
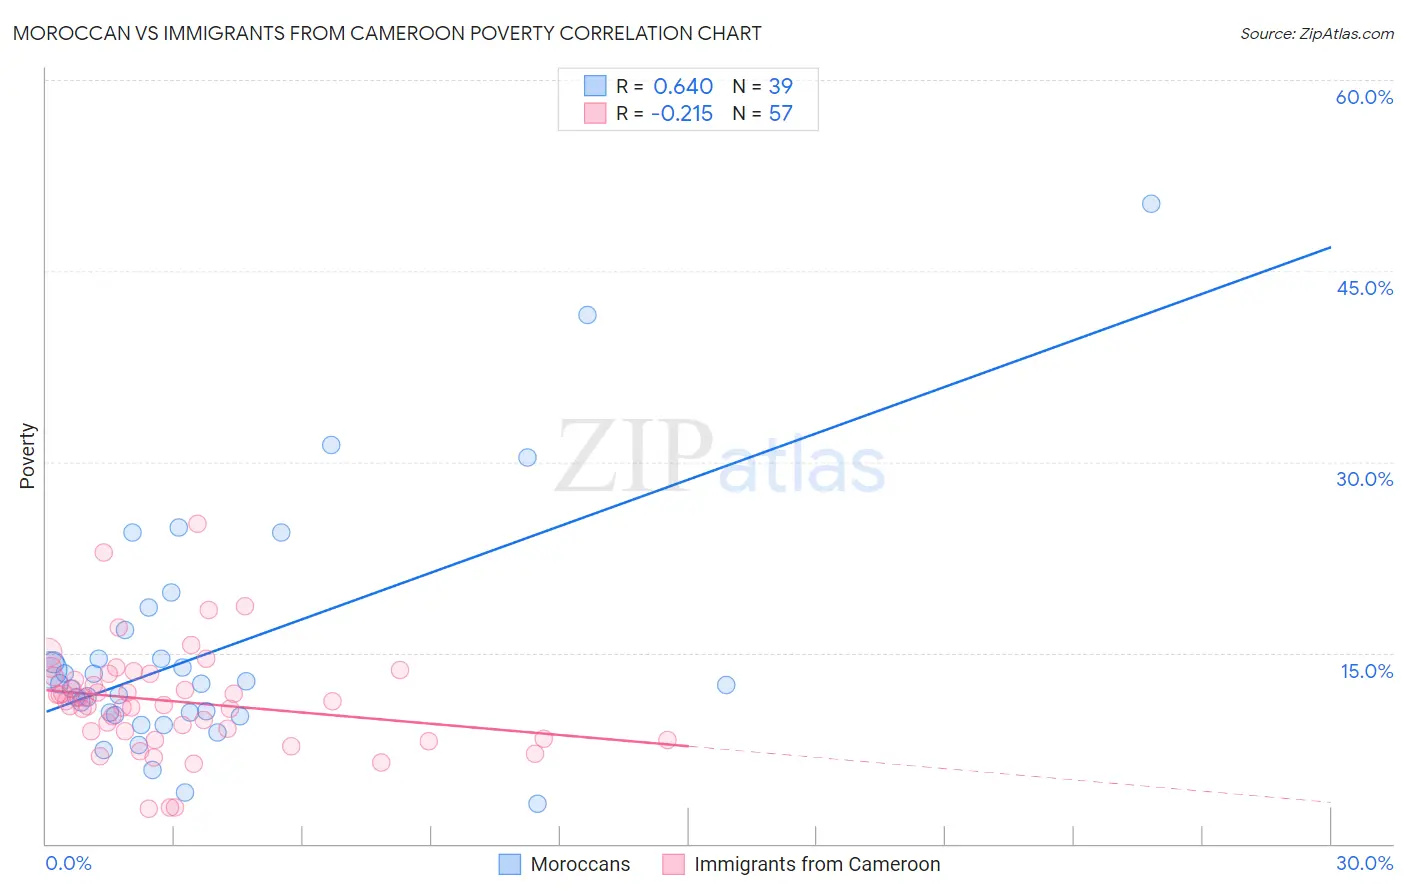
Moroccan vs Immigrants from Cameroon Poverty Correlation Chart
The statistical analysis conducted on geographies consisting of 201,757,500 people shows a significant positive correlation between the proportion of Moroccans and poverty level in the United States with a correlation coefficient (R) of 0.640 and weighted average of 13.2%. Similarly, the statistical analysis conducted on geographies consisting of 130,723,030 people shows a weak negative correlation between the proportion of Immigrants from Cameroon and poverty level in the United States with a correlation coefficient (R) of -0.215 and weighted average of 12.4%, a difference of 6.2%.
Poverty Correlation Summary
| Measurement | Moroccan | Immigrants from Cameroon |
| Minimum | 3.2% | 2.7% |
| Maximum | 50.3% | 25.1% |
| Range | 47.1% | 22.4% |
| Mean | 15.3% | 11.2% |
| Median | 12.5% | 11.2% |
| Interquartile 25% (IQ1) | 10.1% | 8.5% |
| Interquartile 75% (IQ3) | 16.7% | 13.2% |
| Interquartile Range (IQR) | 6.6% | 4.7% |
| Standard Deviation (Sample) | 9.6% | 4.2% |
| Standard Deviation (Population) | 9.5% | 4.1% |
Similar Demographics by Poverty
Demographics Similar to Moroccans by Poverty
In terms of poverty, the demographic groups most similar to Moroccans are Immigrants from the Azores (13.1%, a difference of 0.35%), Malaysian (13.1%, a difference of 0.38%), Ugandan (13.1%, a difference of 0.42%), Immigrants (13.2%, a difference of 0.45%), and Panamanian (13.1%, a difference of 0.57%).
| Demographics | Rating | Rank | Poverty |
| Immigrants | Western Asia | 14.1 /100 | #204 | Poor 12.9% |
| Tsimshian | 9.2 /100 | #205 | Tragic 13.0% |
| Immigrants | Eastern Africa | 7.0 /100 | #206 | Tragic 13.1% |
| Panamanians | 6.6 /100 | #207 | Tragic 13.1% |
| Ugandans | 6.2 /100 | #208 | Tragic 13.1% |
| Malaysians | 6.1 /100 | #209 | Tragic 13.1% |
| Immigrants | Azores | 6.1 /100 | #210 | Tragic 13.1% |
| Moroccans | 5.2 /100 | #211 | Tragic 13.2% |
| Immigrants | Immigrants | 4.3 /100 | #212 | Tragic 13.2% |
| Immigrants | Panama | 4.1 /100 | #213 | Tragic 13.3% |
| Bermudans | 3.7 /100 | #214 | Tragic 13.3% |
| Japanese | 3.3 /100 | #215 | Tragic 13.3% |
| Immigrants | Nonimmigrants | 3.3 /100 | #216 | Tragic 13.3% |
| Immigrants | Uzbekistan | 3.2 /100 | #217 | Tragic 13.3% |
| Immigrants | Thailand | 3.1 /100 | #218 | Tragic 13.3% |
Demographics Similar to Immigrants from Cameroon by Poverty
In terms of poverty, the demographic groups most similar to Immigrants from Cameroon are Immigrants from Afghanistan (12.4%, a difference of 0.040%), Immigrants from Iraq (12.4%, a difference of 0.15%), Mongolian (12.4%, a difference of 0.19%), Immigrants from Morocco (12.4%, a difference of 0.23%), and Uruguayan (12.4%, a difference of 0.29%).
| Demographics | Rating | Rank | Poverty |
| South Americans | 48.7 /100 | #175 | Average 12.3% |
| Immigrants | Colombia | 47.7 /100 | #176 | Average 12.3% |
| Immigrants | Syria | 47.5 /100 | #177 | Average 12.3% |
| Uruguayans | 44.7 /100 | #178 | Average 12.4% |
| Immigrants | Morocco | 44.0 /100 | #179 | Average 12.4% |
| Mongolians | 43.6 /100 | #180 | Average 12.4% |
| Immigrants | Afghanistan | 42.1 /100 | #181 | Average 12.4% |
| Immigrants | Cameroon | 41.7 /100 | #182 | Average 12.4% |
| Immigrants | Iraq | 40.2 /100 | #183 | Average 12.4% |
| Kenyans | 38.8 /100 | #184 | Fair 12.5% |
| Israelis | 36.4 /100 | #185 | Fair 12.5% |
| Immigrants | Sierra Leone | 36.3 /100 | #186 | Fair 12.5% |
| Hawaiians | 34.1 /100 | #187 | Fair 12.5% |
| Immigrants | Costa Rica | 33.3 /100 | #188 | Fair 12.5% |
| Aleuts | 33.2 /100 | #189 | Fair 12.5% |