Immigrants from Laos vs Immigrants from Cameroon Poverty
COMPARE
Immigrants from Laos
Immigrants from Cameroon
Poverty
Poverty Comparison
Immigrants from Laos
Immigrants from Cameroon
13.8%
POVERTY
0.7/ 100
METRIC RATING
234th/ 347
METRIC RANK
12.4%
POVERTY
41.7/ 100
METRIC RATING
182nd/ 347
METRIC RANK
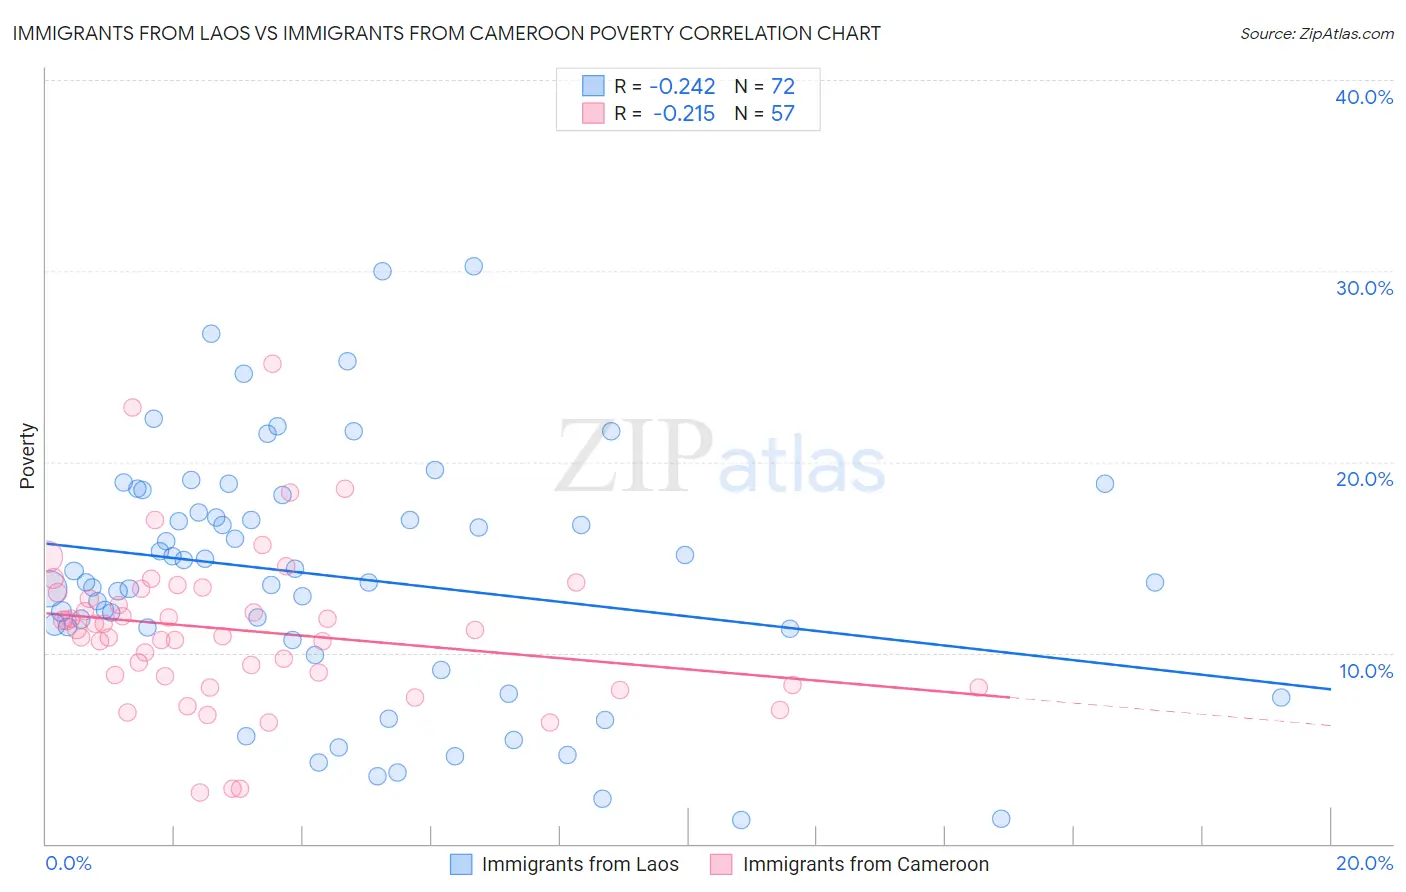
Immigrants from Laos vs Immigrants from Cameroon Poverty Correlation Chart
The statistical analysis conducted on geographies consisting of 201,466,628 people shows a weak negative correlation between the proportion of Immigrants from Laos and poverty level in the United States with a correlation coefficient (R) of -0.242 and weighted average of 13.8%. Similarly, the statistical analysis conducted on geographies consisting of 130,723,030 people shows a weak negative correlation between the proportion of Immigrants from Cameroon and poverty level in the United States with a correlation coefficient (R) of -0.215 and weighted average of 12.4%, a difference of 11.2%.
Poverty Correlation Summary
| Measurement | Immigrants from Laos | Immigrants from Cameroon |
| Minimum | 1.2% | 2.7% |
| Maximum | 30.2% | 25.1% |
| Range | 29.0% | 22.4% |
| Mean | 14.0% | 11.2% |
| Median | 13.7% | 11.2% |
| Interquartile 25% (IQ1) | 11.0% | 8.5% |
| Interquartile 75% (IQ3) | 17.8% | 13.2% |
| Interquartile Range (IQR) | 6.8% | 4.7% |
| Standard Deviation (Sample) | 6.5% | 4.2% |
| Standard Deviation (Population) | 6.4% | 4.1% |
Similar Demographics by Poverty
Demographics Similar to Immigrants from Laos by Poverty
In terms of poverty, the demographic groups most similar to Immigrants from Laos are Immigrants from Saudi Arabia (13.8%, a difference of 0.24%), Cuban (13.9%, a difference of 0.44%), Immigrants from Armenia (13.9%, a difference of 0.47%), Fijian (13.7%, a difference of 0.49%), and French American Indian (13.9%, a difference of 0.49%).
| Demographics | Rating | Rank | Poverty |
| Alaska Natives | 2.1 /100 | #227 | Tragic 13.5% |
| Immigrants | Nigeria | 1.7 /100 | #228 | Tragic 13.5% |
| Osage | 1.5 /100 | #229 | Tragic 13.6% |
| Alaskan Athabascans | 1.5 /100 | #230 | Tragic 13.6% |
| Nigerians | 1.4 /100 | #231 | Tragic 13.6% |
| Fijians | 0.8 /100 | #232 | Tragic 13.7% |
| Immigrants | Saudi Arabia | 0.8 /100 | #233 | Tragic 13.8% |
| Immigrants | Laos | 0.7 /100 | #234 | Tragic 13.8% |
| Cubans | 0.6 /100 | #235 | Tragic 13.9% |
| Immigrants | Armenia | 0.5 /100 | #236 | Tragic 13.9% |
| French American Indians | 0.5 /100 | #237 | Tragic 13.9% |
| Ghanaians | 0.5 /100 | #238 | Tragic 13.9% |
| Nicaraguans | 0.4 /100 | #239 | Tragic 13.9% |
| Immigrants | Middle Africa | 0.4 /100 | #240 | Tragic 14.0% |
| Salvadorans | 0.4 /100 | #241 | Tragic 14.0% |
Demographics Similar to Immigrants from Cameroon by Poverty
In terms of poverty, the demographic groups most similar to Immigrants from Cameroon are Immigrants from Afghanistan (12.4%, a difference of 0.040%), Immigrants from Iraq (12.4%, a difference of 0.15%), Mongolian (12.4%, a difference of 0.19%), Immigrants from Morocco (12.4%, a difference of 0.23%), and Uruguayan (12.4%, a difference of 0.29%).
| Demographics | Rating | Rank | Poverty |
| South Americans | 48.7 /100 | #175 | Average 12.3% |
| Immigrants | Colombia | 47.7 /100 | #176 | Average 12.3% |
| Immigrants | Syria | 47.5 /100 | #177 | Average 12.3% |
| Uruguayans | 44.7 /100 | #178 | Average 12.4% |
| Immigrants | Morocco | 44.0 /100 | #179 | Average 12.4% |
| Mongolians | 43.6 /100 | #180 | Average 12.4% |
| Immigrants | Afghanistan | 42.1 /100 | #181 | Average 12.4% |
| Immigrants | Cameroon | 41.7 /100 | #182 | Average 12.4% |
| Immigrants | Iraq | 40.2 /100 | #183 | Average 12.4% |
| Kenyans | 38.8 /100 | #184 | Fair 12.5% |
| Israelis | 36.4 /100 | #185 | Fair 12.5% |
| Immigrants | Sierra Leone | 36.3 /100 | #186 | Fair 12.5% |
| Hawaiians | 34.1 /100 | #187 | Fair 12.5% |
| Immigrants | Costa Rica | 33.3 /100 | #188 | Fair 12.5% |
| Aleuts | 33.2 /100 | #189 | Fair 12.5% |