Moroccan vs Immigrants from Cameroon In Labor Force | Age 35-44
COMPARE
Moroccan
Immigrants from Cameroon
In Labor Force | Age 35-44
In Labor Force | Age 35-44 Comparison
Moroccans
Immigrants from Cameroon
84.2%
IN LABOR FORCE | AGE 35-44
23.2/ 100
METRIC RATING
200th/ 347
METRIC RANK
85.8%
IN LABOR FORCE | AGE 35-44
100.0/ 100
METRIC RATING
11th/ 347
METRIC RANK
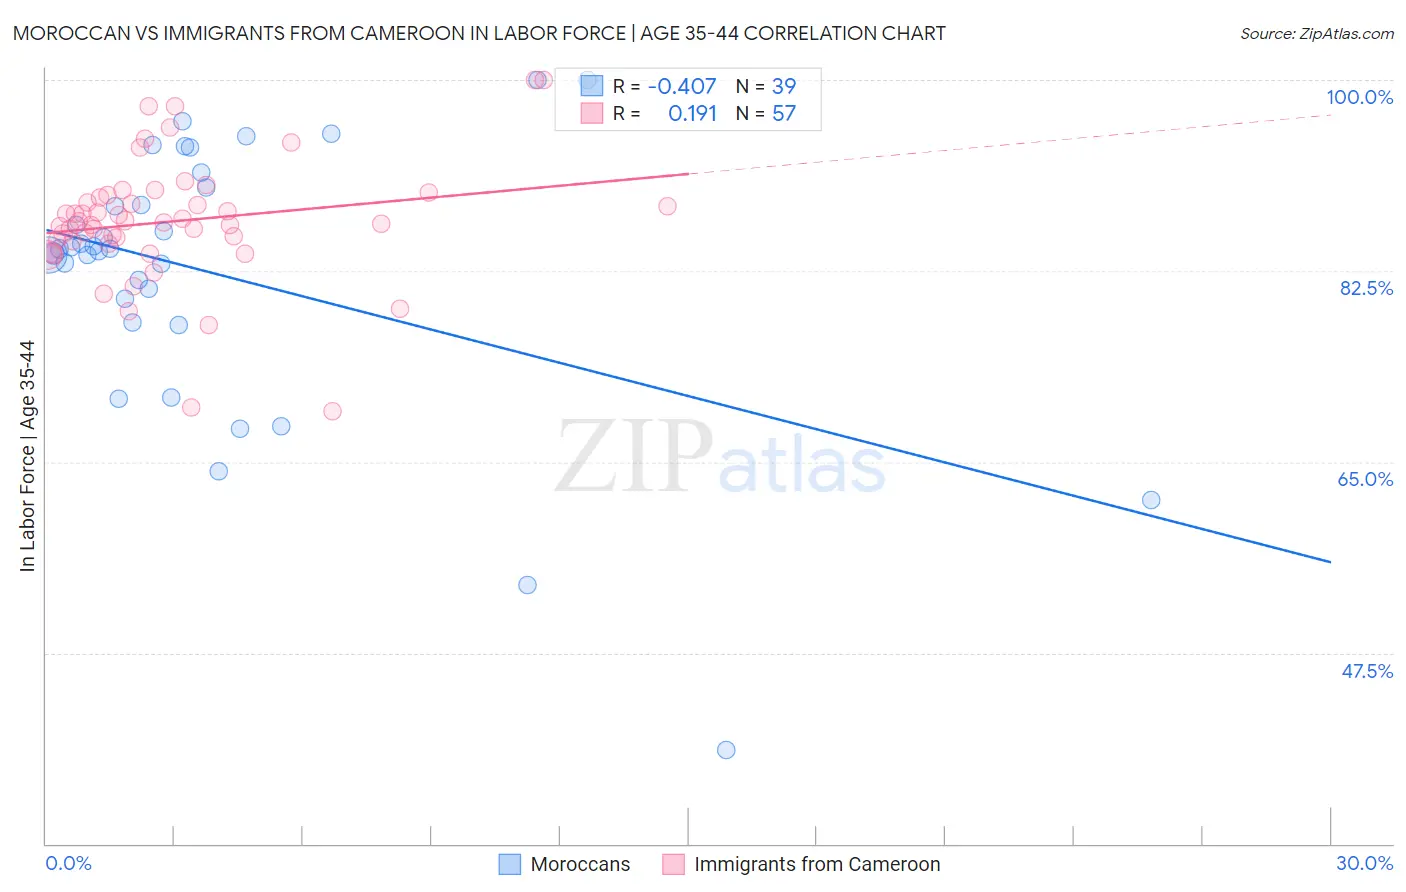
Moroccan vs Immigrants from Cameroon In Labor Force | Age 35-44 Correlation Chart
The statistical analysis conducted on geographies consisting of 201,769,672 people shows a moderate negative correlation between the proportion of Moroccans and labor force participation rate among population between the ages 35 and 44 in the United States with a correlation coefficient (R) of -0.407 and weighted average of 84.2%. Similarly, the statistical analysis conducted on geographies consisting of 130,741,497 people shows a poor positive correlation between the proportion of Immigrants from Cameroon and labor force participation rate among population between the ages 35 and 44 in the United States with a correlation coefficient (R) of 0.191 and weighted average of 85.8%, a difference of 1.8%.
In Labor Force | Age 35-44 Correlation Summary
| Measurement | Moroccan | Immigrants from Cameroon |
| Minimum | 38.6% | 69.6% |
| Maximum | 100.0% | 100.0% |
| Range | 61.4% | 30.4% |
| Mean | 82.2% | 87.1% |
| Median | 84.5% | 86.9% |
| Interquartile 25% (IQ1) | 77.7% | 85.1% |
| Interquartile 75% (IQ3) | 90.1% | 89.3% |
| Interquartile Range (IQR) | 12.4% | 4.2% |
| Standard Deviation (Sample) | 12.6% | 5.7% |
| Standard Deviation (Population) | 12.5% | 5.7% |
Similar Demographics by In Labor Force | Age 35-44
Demographics Similar to Moroccans by In Labor Force | Age 35-44
In terms of in labor force | age 35-44, the demographic groups most similar to Moroccans are Syrian (84.2%, a difference of 0.0%), British (84.2%, a difference of 0.0%), Immigrants from Uzbekistan (84.2%, a difference of 0.0%), Immigrants from Western Europe (84.2%, a difference of 0.010%), and Ecuadorian (84.2%, a difference of 0.010%).
| Demographics | Rating | Rank | In Labor Force | Age 35-44 |
| Hungarians | 26.8 /100 | #193 | Fair 84.2% |
| Immigrants | Indonesia | 25.7 /100 | #194 | Fair 84.2% |
| Immigrants | Caribbean | 25.7 /100 | #195 | Fair 84.2% |
| Immigrants | England | 25.0 /100 | #196 | Fair 84.2% |
| Immigrants | Western Europe | 24.7 /100 | #197 | Fair 84.2% |
| Ecuadorians | 24.0 /100 | #198 | Fair 84.2% |
| Syrians | 23.2 /100 | #199 | Fair 84.2% |
| Moroccans | 23.2 /100 | #200 | Fair 84.2% |
| British | 23.0 /100 | #201 | Fair 84.2% |
| Immigrants | Uzbekistan | 22.8 /100 | #202 | Fair 84.2% |
| Immigrants | South Eastern Asia | 22.4 /100 | #203 | Fair 84.2% |
| Canadians | 19.9 /100 | #204 | Poor 84.2% |
| Immigrants | Canada | 19.6 /100 | #205 | Poor 84.2% |
| Immigrants | Costa Rica | 19.5 /100 | #206 | Poor 84.2% |
| Laotians | 19.0 /100 | #207 | Poor 84.2% |
Demographics Similar to Immigrants from Cameroon by In Labor Force | Age 35-44
In terms of in labor force | age 35-44, the demographic groups most similar to Immigrants from Cameroon are Cape Verdean (85.8%, a difference of 0.030%), Liberian (85.7%, a difference of 0.12%), Somali (85.6%, a difference of 0.14%), Immigrants from Somalia (85.6%, a difference of 0.14%), and Immigrants from Ethiopia (85.9%, a difference of 0.16%).
| Demographics | Rating | Rank | In Labor Force | Age 35-44 |
| Immigrants | Cabo Verde | 100.0 /100 | #4 | Exceptional 86.2% |
| Zimbabweans | 100.0 /100 | #5 | Exceptional 86.1% |
| Bolivians | 100.0 /100 | #6 | Exceptional 86.1% |
| Immigrants | Sierra Leone | 100.0 /100 | #7 | Exceptional 86.1% |
| Immigrants | Ethiopia | 100.0 /100 | #8 | Exceptional 85.9% |
| Ethiopians | 100.0 /100 | #9 | Exceptional 85.9% |
| Cape Verdeans | 100.0 /100 | #10 | Exceptional 85.8% |
| Immigrants | Cameroon | 100.0 /100 | #11 | Exceptional 85.8% |
| Liberians | 100.0 /100 | #12 | Exceptional 85.7% |
| Somalis | 100.0 /100 | #13 | Exceptional 85.6% |
| Immigrants | Somalia | 100.0 /100 | #14 | Exceptional 85.6% |
| Norwegians | 100.0 /100 | #15 | Exceptional 85.6% |
| Immigrants | Ireland | 100.0 /100 | #16 | Exceptional 85.6% |
| Immigrants | North Macedonia | 100.0 /100 | #17 | Exceptional 85.6% |
| Carpatho Rusyns | 100.0 /100 | #18 | Exceptional 85.6% |