Moroccan vs Senegalese Child Poverty Among Boys Under 16
COMPARE
Moroccan
Senegalese
Child Poverty Among Boys Under 16
Child Poverty Among Boys Under 16 Comparison
Moroccans
Senegalese
17.7%
CHILD POVERTY AMONG BOYS UNDER 16
5.6/ 100
METRIC RATING
216th/ 347
METRIC RANK
20.6%
CHILD POVERTY AMONG BOYS UNDER 16
0.0/ 100
METRIC RATING
290th/ 347
METRIC RANK
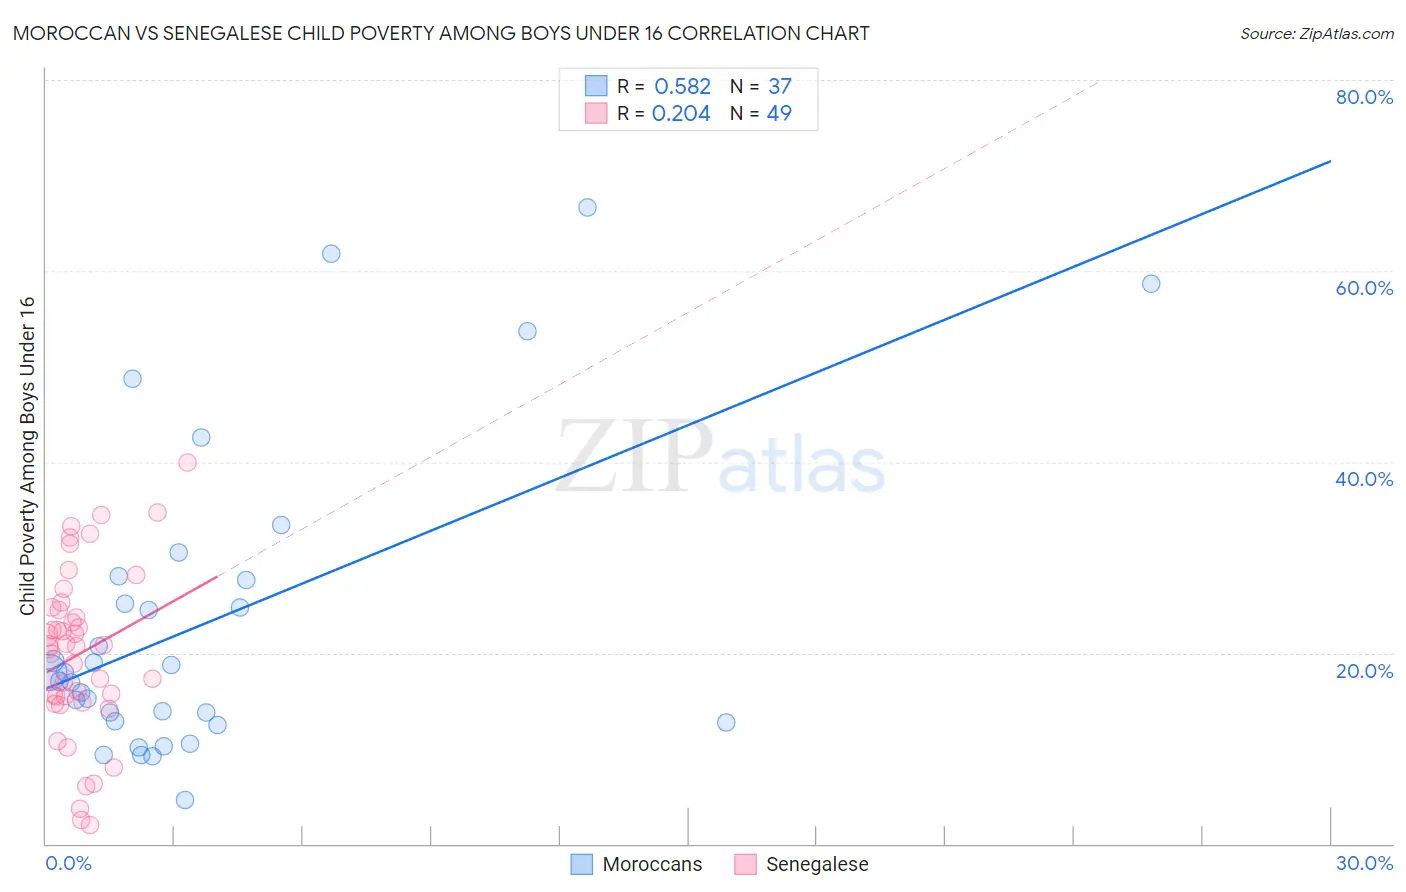
Moroccan vs Senegalese Child Poverty Among Boys Under 16 Correlation Chart
The statistical analysis conducted on geographies consisting of 200,157,995 people shows a substantial positive correlation between the proportion of Moroccans and poverty level among boys under the age of 16 in the United States with a correlation coefficient (R) of 0.582 and weighted average of 17.7%. Similarly, the statistical analysis conducted on geographies consisting of 77,929,825 people shows a weak positive correlation between the proportion of Senegalese and poverty level among boys under the age of 16 in the United States with a correlation coefficient (R) of 0.204 and weighted average of 20.6%, a difference of 15.9%.
Child Poverty Among Boys Under 16 Correlation Summary
| Measurement | Moroccan | Senegalese |
| Minimum | 4.6% | 2.0% |
| Maximum | 66.7% | 40.0% |
| Range | 62.1% | 38.0% |
| Mean | 23.3% | 19.9% |
| Median | 17.9% | 20.7% |
| Interquartile 25% (IQ1) | 12.8% | 15.1% |
| Interquartile 75% (IQ3) | 27.8% | 24.6% |
| Interquartile Range (IQR) | 15.1% | 9.5% |
| Standard Deviation (Sample) | 16.0% | 8.7% |
| Standard Deviation (Population) | 15.8% | 8.6% |
Similar Demographics by Child Poverty Among Boys Under 16
Demographics Similar to Moroccans by Child Poverty Among Boys Under 16
In terms of child poverty among boys under 16, the demographic groups most similar to Moroccans are Japanese (17.7%, a difference of 0.030%), Iraqi (17.7%, a difference of 0.050%), Osage (17.7%, a difference of 0.090%), Sierra Leonean (17.8%, a difference of 0.13%), and Panamanian (17.7%, a difference of 0.16%).
| Demographics | Rating | Rank | Child Poverty Among Boys Under 16 |
| Alaskan Athabascans | 7.3 /100 | #209 | Tragic 17.6% |
| Immigrants | Armenia | 6.8 /100 | #210 | Tragic 17.6% |
| Immigrants | Immigrants | 6.7 /100 | #211 | Tragic 17.6% |
| Aleuts | 6.6 /100 | #212 | Tragic 17.7% |
| Immigrants | Eastern Africa | 6.0 /100 | #213 | Tragic 17.7% |
| Panamanians | 5.9 /100 | #214 | Tragic 17.7% |
| Osage | 5.8 /100 | #215 | Tragic 17.7% |
| Moroccans | 5.6 /100 | #216 | Tragic 17.7% |
| Japanese | 5.5 /100 | #217 | Tragic 17.7% |
| Iraqis | 5.5 /100 | #218 | Tragic 17.7% |
| Sierra Leoneans | 5.3 /100 | #219 | Tragic 17.8% |
| Immigrants | Cambodia | 5.1 /100 | #220 | Tragic 17.8% |
| Immigrants | Panama | 4.3 /100 | #221 | Tragic 17.9% |
| Pennsylvania Germans | 3.9 /100 | #222 | Tragic 17.9% |
| Cubans | 3.8 /100 | #223 | Tragic 17.9% |
Demographics Similar to Senegalese by Child Poverty Among Boys Under 16
In terms of child poverty among boys under 16, the demographic groups most similar to Senegalese are Immigrants from Latin America (20.6%, a difference of 0.44%), Yaqui (20.7%, a difference of 0.70%), Immigrants from Senegal (20.7%, a difference of 0.71%), Immigrants from Bahamas (20.7%, a difference of 0.83%), and Blackfeet (20.4%, a difference of 0.91%).
| Demographics | Rating | Rank | Child Poverty Among Boys Under 16 |
| Immigrants | Jamaica | 0.0 /100 | #283 | Tragic 20.1% |
| Barbadians | 0.0 /100 | #284 | Tragic 20.2% |
| Arapaho | 0.0 /100 | #285 | Tragic 20.2% |
| West Indians | 0.0 /100 | #286 | Tragic 20.3% |
| Immigrants | Belize | 0.0 /100 | #287 | Tragic 20.3% |
| Immigrants | St. Vincent and the Grenadines | 0.0 /100 | #288 | Tragic 20.3% |
| Blackfeet | 0.0 /100 | #289 | Tragic 20.4% |
| Senegalese | 0.0 /100 | #290 | Tragic 20.6% |
| Immigrants | Latin America | 0.0 /100 | #291 | Tragic 20.6% |
| Yaqui | 0.0 /100 | #292 | Tragic 20.7% |
| Immigrants | Senegal | 0.0 /100 | #293 | Tragic 20.7% |
| Immigrants | Bahamas | 0.0 /100 | #294 | Tragic 20.7% |
| Mexicans | 0.0 /100 | #295 | Tragic 20.7% |
| Indonesians | 0.0 /100 | #296 | Tragic 20.8% |
| Hispanics or Latinos | 0.0 /100 | #297 | Tragic 20.9% |