Mongolian vs Austrian Child Poverty Under the Age of 5
COMPARE
Mongolian
Austrian
Child Poverty Under the Age of 5
Child Poverty Under the Age of 5 Comparison
Mongolians
Austrians
16.1%
CHILD POVERTY UNDER THE AGE OF 5
92.5/ 100
METRIC RATING
121st/ 347
METRIC RANK
16.1%
CHILD POVERTY UNDER THE AGE OF 5
92.0/ 100
METRIC RATING
123rd/ 347
METRIC RANK
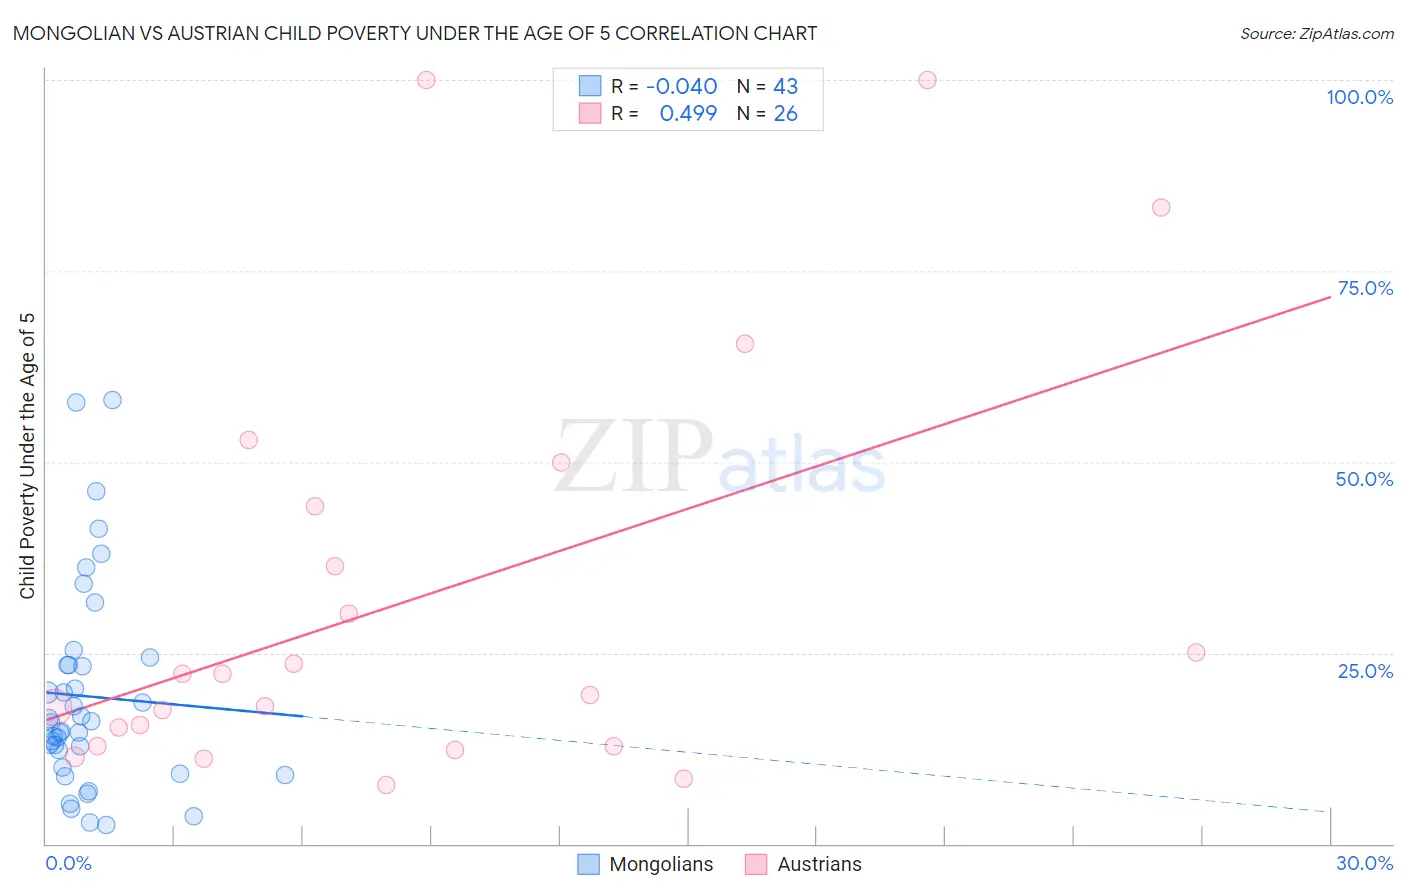
Mongolian vs Austrian Child Poverty Under the Age of 5 Correlation Chart
The statistical analysis conducted on geographies consisting of 138,133,739 people shows no correlation between the proportion of Mongolians and poverty level among children under the age of 5 in the United States with a correlation coefficient (R) of -0.040 and weighted average of 16.1%. Similarly, the statistical analysis conducted on geographies consisting of 426,879,815 people shows a moderate positive correlation between the proportion of Austrians and poverty level among children under the age of 5 in the United States with a correlation coefficient (R) of 0.499 and weighted average of 16.1%, a difference of 0.22%.
Child Poverty Under the Age of 5 Correlation Summary
| Measurement | Mongolian | Austrian |
| Minimum | 2.4% | 7.7% |
| Maximum | 58.2% | 100.0% |
| Range | 55.7% | 92.3% |
| Mean | 19.3% | 32.1% |
| Median | 15.9% | 20.8% |
| Interquartile 25% (IQ1) | 10.0% | 12.8% |
| Interquartile 75% (IQ3) | 23.5% | 44.1% |
| Interquartile Range (IQR) | 13.5% | 31.3% |
| Standard Deviation (Sample) | 13.5% | 27.3% |
| Standard Deviation (Population) | 13.3% | 26.8% |
Demographics Similar to Mongolians and Austrians by Child Poverty Under the Age of 5
In terms of child poverty under the age of 5, the demographic groups most similar to Mongolians are Immigrants from Peru (16.1%, a difference of 0.010%), Immigrants from Southern Europe (16.1%, a difference of 0.20%), Swiss (16.1%, a difference of 0.23%), Immigrants from Jordan (16.1%, a difference of 0.27%), and Native Hawaiian (16.2%, a difference of 0.30%). Similarly, the demographic groups most similar to Austrians are Swiss (16.1%, a difference of 0.010%), Immigrants from Southern Europe (16.1%, a difference of 0.030%), Native Hawaiian (16.2%, a difference of 0.080%), Immigrants from Albania (16.2%, a difference of 0.080%), and Immigrants from England (16.2%, a difference of 0.17%).
| Demographics | Rating | Rank | Child Poverty Under the Age of 5 |
| Peruvians | 94.1 /100 | #112 | Exceptional 16.0% |
| Puget Sound Salish | 94.1 /100 | #113 | Exceptional 16.0% |
| Immigrants | Kuwait | 93.9 /100 | #114 | Exceptional 16.0% |
| Albanians | 93.8 /100 | #115 | Exceptional 16.0% |
| Immigrants | Austria | 93.5 /100 | #116 | Exceptional 16.0% |
| Basques | 93.4 /100 | #117 | Exceptional 16.0% |
| Immigrants | Denmark | 93.4 /100 | #118 | Exceptional 16.0% |
| Immigrants | Jordan | 93.2 /100 | #119 | Exceptional 16.1% |
| Immigrants | Peru | 92.6 /100 | #120 | Exceptional 16.1% |
| Mongolians | 92.5 /100 | #121 | Exceptional 16.1% |
| Immigrants | Southern Europe | 92.0 /100 | #122 | Exceptional 16.1% |
| Austrians | 92.0 /100 | #123 | Exceptional 16.1% |
| Swiss | 92.0 /100 | #124 | Exceptional 16.1% |
| Native Hawaiians | 91.8 /100 | #125 | Exceptional 16.2% |
| Immigrants | Albania | 91.8 /100 | #126 | Exceptional 16.2% |
| Immigrants | England | 91.5 /100 | #127 | Exceptional 16.2% |
| South Africans | 90.1 /100 | #128 | Exceptional 16.2% |
| British | 89.4 /100 | #129 | Excellent 16.3% |
| Immigrants | Norway | 89.3 /100 | #130 | Excellent 16.3% |
| Finns | 88.3 /100 | #131 | Excellent 16.3% |
| Serbians | 88.2 /100 | #132 | Excellent 16.3% |