Mongolian vs Immigrants from Thailand Receiving Food Stamps
COMPARE
Mongolian
Immigrants from Thailand
Receiving Food Stamps
Receiving Food Stamps Comparison
Mongolians
Immigrants from Thailand
10.5%
RECEIVING FOOD STAMPS
95.8/ 100
METRIC RATING
112th/ 347
METRIC RANK
12.4%
RECEIVING FOOD STAMPS
17.0/ 100
METRIC RATING
206th/ 347
METRIC RANK
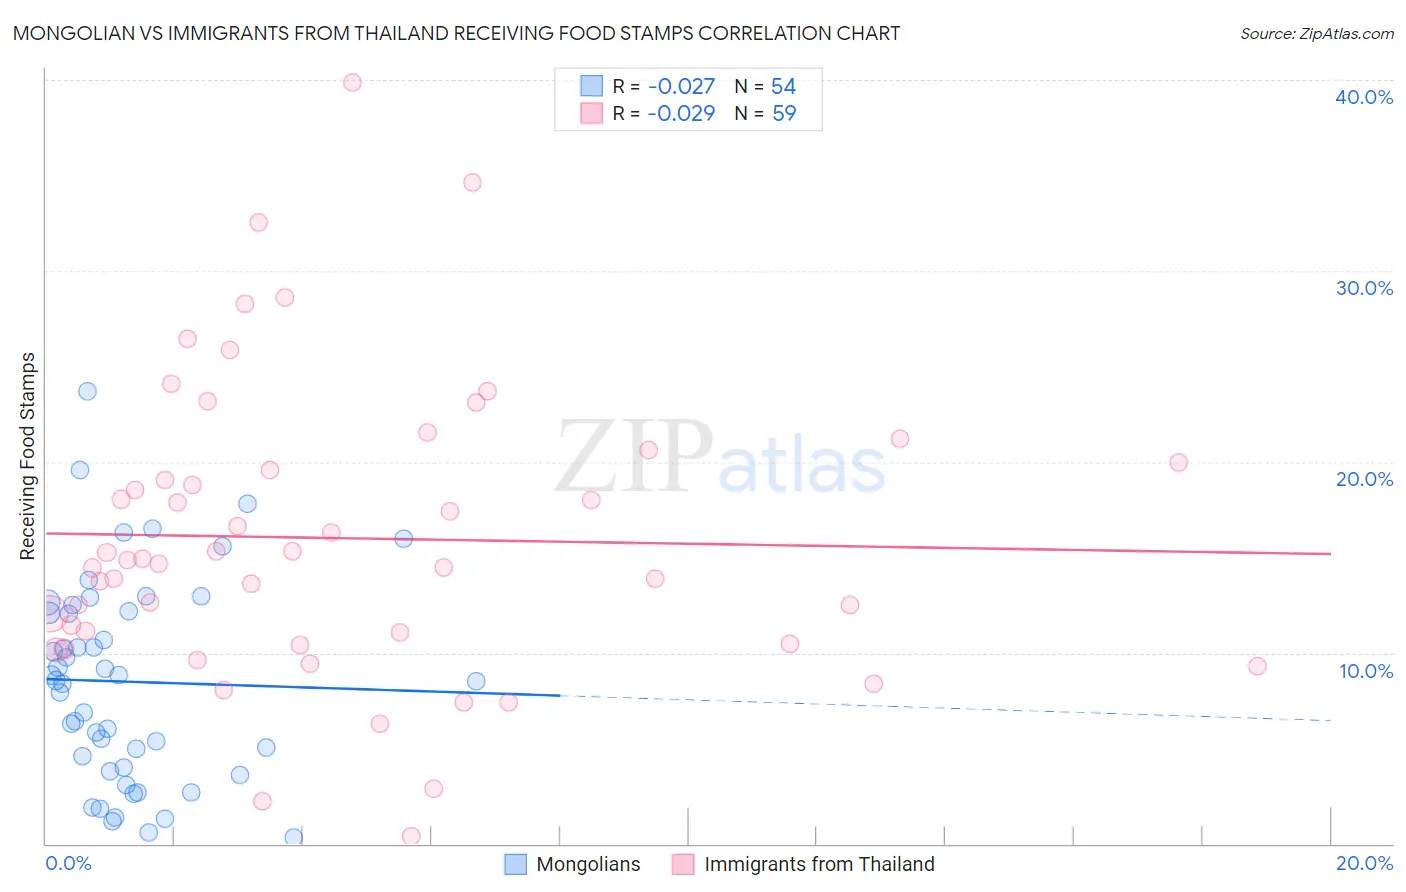
Mongolian vs Immigrants from Thailand Receiving Food Stamps Correlation Chart
The statistical analysis conducted on geographies consisting of 140,177,644 people shows no correlation between the proportion of Mongolians and percentage of population receiving government assistance and/or food stamps in the United States with a correlation coefficient (R) of -0.027 and weighted average of 10.5%. Similarly, the statistical analysis conducted on geographies consisting of 316,534,905 people shows no correlation between the proportion of Immigrants from Thailand and percentage of population receiving government assistance and/or food stamps in the United States with a correlation coefficient (R) of -0.029 and weighted average of 12.4%, a difference of 18.5%.
Receiving Food Stamps Correlation Summary
| Measurement | Mongolian | Immigrants from Thailand |
| Minimum | 0.30% | 0.40% |
| Maximum | 23.7% | 39.9% |
| Range | 23.4% | 39.5% |
| Mean | 8.5% | 16.0% |
| Median | 8.5% | 14.9% |
| Interquartile 25% (IQ1) | 4.0% | 10.5% |
| Interquartile 75% (IQ3) | 12.2% | 20.0% |
| Interquartile Range (IQR) | 8.2% | 9.5% |
| Standard Deviation (Sample) | 5.3% | 7.7% |
| Standard Deviation (Population) | 5.3% | 7.7% |
Similar Demographics by Receiving Food Stamps
Demographics Similar to Mongolians by Receiving Food Stamps
In terms of receiving food stamps, the demographic groups most similar to Mongolians are Romanian (10.4%, a difference of 0.010%), Pakistani (10.4%, a difference of 0.11%), Icelander (10.5%, a difference of 0.38%), Immigrants from Pakistan (10.4%, a difference of 0.39%), and Carpatho Rusyn (10.4%, a difference of 0.44%).
| Demographics | Rating | Rank | Receiving Food Stamps |
| Immigrants | Malaysia | 96.5 /100 | #105 | Exceptional 10.4% |
| Immigrants | Italy | 96.4 /100 | #106 | Exceptional 10.4% |
| Koreans | 96.3 /100 | #107 | Exceptional 10.4% |
| Carpatho Rusyns | 96.2 /100 | #108 | Exceptional 10.4% |
| Immigrants | Pakistan | 96.2 /100 | #109 | Exceptional 10.4% |
| Pakistanis | 95.9 /100 | #110 | Exceptional 10.4% |
| Romanians | 95.8 /100 | #111 | Exceptional 10.4% |
| Mongolians | 95.8 /100 | #112 | Exceptional 10.5% |
| Icelanders | 95.4 /100 | #113 | Exceptional 10.5% |
| Scotch-Irish | 95.1 /100 | #114 | Exceptional 10.5% |
| Immigrants | Saudi Arabia | 94.9 /100 | #115 | Exceptional 10.5% |
| Canadians | 94.8 /100 | #116 | Exceptional 10.5% |
| Immigrants | Nepal | 94.6 /100 | #117 | Exceptional 10.6% |
| Assyrians/Chaldeans/Syriacs | 94.1 /100 | #118 | Exceptional 10.6% |
| Immigrants | Poland | 93.9 /100 | #119 | Exceptional 10.6% |
Demographics Similar to Immigrants from Thailand by Receiving Food Stamps
In terms of receiving food stamps, the demographic groups most similar to Immigrants from Thailand are Aleut (12.4%, a difference of 0.060%), Nonimmigrants (12.4%, a difference of 0.13%), Shoshone (12.4%, a difference of 0.16%), South American (12.4%, a difference of 0.26%), and Potawatomi (12.5%, a difference of 0.62%).
| Demographics | Rating | Rank | Receiving Food Stamps |
| Portuguese | 25.1 /100 | #199 | Fair 12.2% |
| Sierra Leoneans | 23.6 /100 | #200 | Fair 12.2% |
| Ugandans | 22.5 /100 | #201 | Fair 12.2% |
| Immigrants | Venezuela | 20.1 /100 | #202 | Fair 12.3% |
| Shoshone | 17.7 /100 | #203 | Poor 12.4% |
| Immigrants | Nonimmigrants | 17.6 /100 | #204 | Poor 12.4% |
| Aleuts | 17.3 /100 | #205 | Poor 12.4% |
| Immigrants | Thailand | 17.0 /100 | #206 | Poor 12.4% |
| South Americans | 16.0 /100 | #207 | Poor 12.4% |
| Potawatomi | 14.6 /100 | #208 | Poor 12.5% |
| Immigrants | Sierra Leone | 12.9 /100 | #209 | Poor 12.5% |
| Immigrants | Uruguay | 12.8 /100 | #210 | Poor 12.5% |
| Colombians | 10.2 /100 | #211 | Poor 12.6% |
| Malaysians | 8.5 /100 | #212 | Tragic 12.7% |
| Moroccans | 7.6 /100 | #213 | Tragic 12.8% |