Mongolian vs Immigrants from Armenia Receiving Food Stamps
COMPARE
Mongolian
Immigrants from Armenia
Receiving Food Stamps
Receiving Food Stamps Comparison
Mongolians
Immigrants from Armenia
10.5%
RECEIVING FOOD STAMPS
95.8/ 100
METRIC RATING
112th/ 347
METRIC RANK
13.0%
RECEIVING FOOD STAMPS
4.3/ 100
METRIC RATING
224th/ 347
METRIC RANK
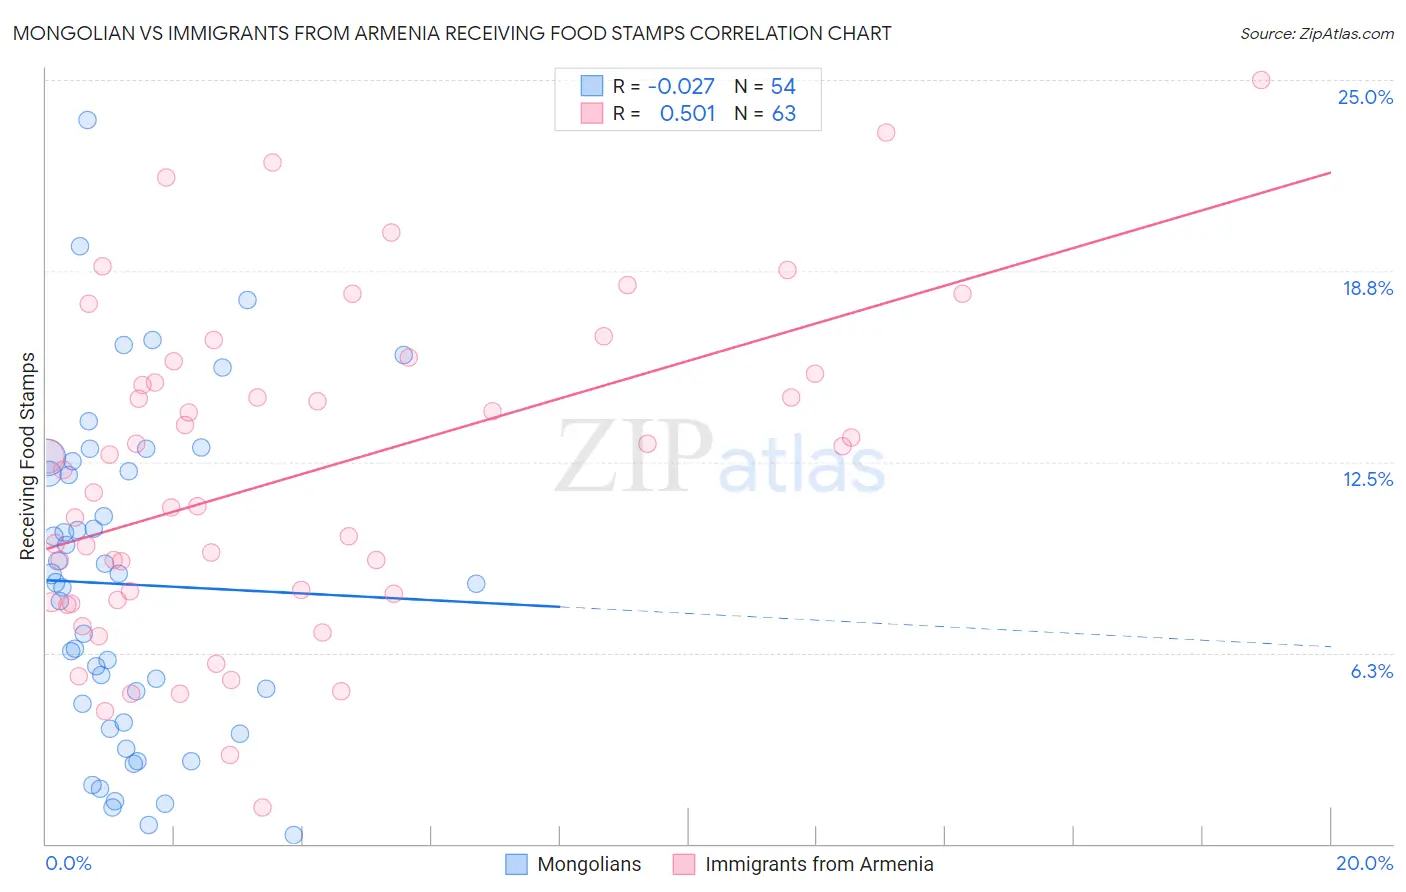
Mongolian vs Immigrants from Armenia Receiving Food Stamps Correlation Chart
The statistical analysis conducted on geographies consisting of 140,177,644 people shows no correlation between the proportion of Mongolians and percentage of population receiving government assistance and/or food stamps in the United States with a correlation coefficient (R) of -0.027 and weighted average of 10.5%. Similarly, the statistical analysis conducted on geographies consisting of 97,612,331 people shows a substantial positive correlation between the proportion of Immigrants from Armenia and percentage of population receiving government assistance and/or food stamps in the United States with a correlation coefficient (R) of 0.501 and weighted average of 13.0%, a difference of 24.5%.
Receiving Food Stamps Correlation Summary
| Measurement | Mongolian | Immigrants from Armenia |
| Minimum | 0.30% | 1.2% |
| Maximum | 23.7% | 25.0% |
| Range | 23.4% | 23.8% |
| Mean | 8.5% | 12.1% |
| Median | 8.5% | 12.2% |
| Interquartile 25% (IQ1) | 4.0% | 8.0% |
| Interquartile 75% (IQ3) | 12.2% | 15.4% |
| Interquartile Range (IQR) | 8.2% | 7.4% |
| Standard Deviation (Sample) | 5.3% | 5.3% |
| Standard Deviation (Population) | 5.3% | 5.2% |
Similar Demographics by Receiving Food Stamps
Demographics Similar to Mongolians by Receiving Food Stamps
In terms of receiving food stamps, the demographic groups most similar to Mongolians are Romanian (10.4%, a difference of 0.010%), Pakistani (10.4%, a difference of 0.11%), Icelander (10.5%, a difference of 0.38%), Immigrants from Pakistan (10.4%, a difference of 0.39%), and Carpatho Rusyn (10.4%, a difference of 0.44%).
| Demographics | Rating | Rank | Receiving Food Stamps |
| Immigrants | Malaysia | 96.5 /100 | #105 | Exceptional 10.4% |
| Immigrants | Italy | 96.4 /100 | #106 | Exceptional 10.4% |
| Koreans | 96.3 /100 | #107 | Exceptional 10.4% |
| Carpatho Rusyns | 96.2 /100 | #108 | Exceptional 10.4% |
| Immigrants | Pakistan | 96.2 /100 | #109 | Exceptional 10.4% |
| Pakistanis | 95.9 /100 | #110 | Exceptional 10.4% |
| Romanians | 95.8 /100 | #111 | Exceptional 10.4% |
| Mongolians | 95.8 /100 | #112 | Exceptional 10.5% |
| Icelanders | 95.4 /100 | #113 | Exceptional 10.5% |
| Scotch-Irish | 95.1 /100 | #114 | Exceptional 10.5% |
| Immigrants | Saudi Arabia | 94.9 /100 | #115 | Exceptional 10.5% |
| Canadians | 94.8 /100 | #116 | Exceptional 10.5% |
| Immigrants | Nepal | 94.6 /100 | #117 | Exceptional 10.6% |
| Assyrians/Chaldeans/Syriacs | 94.1 /100 | #118 | Exceptional 10.6% |
| Immigrants | Poland | 93.9 /100 | #119 | Exceptional 10.6% |
Demographics Similar to Immigrants from Armenia by Receiving Food Stamps
In terms of receiving food stamps, the demographic groups most similar to Immigrants from Armenia are Fijian (13.0%, a difference of 0.020%), Immigrants from Albania (13.0%, a difference of 0.070%), Immigrants (13.0%, a difference of 0.11%), Bermudan (13.0%, a difference of 0.37%), and Chickasaw (13.1%, a difference of 0.62%).
| Demographics | Rating | Rank | Receiving Food Stamps |
| Immigrants | Burma/Myanmar | 6.0 /100 | #217 | Tragic 12.9% |
| Hawaiians | 5.4 /100 | #218 | Tragic 12.9% |
| Immigrants | Middle Africa | 5.4 /100 | #219 | Tragic 12.9% |
| Immigrants | Colombia | 5.3 /100 | #220 | Tragic 12.9% |
| Bermudans | 4.8 /100 | #221 | Tragic 13.0% |
| Immigrants | Immigrants | 4.4 /100 | #222 | Tragic 13.0% |
| Immigrants | Albania | 4.4 /100 | #223 | Tragic 13.0% |
| Immigrants | Armenia | 4.3 /100 | #224 | Tragic 13.0% |
| Fijians | 4.3 /100 | #225 | Tragic 13.0% |
| Chickasaw | 3.6 /100 | #226 | Tragic 13.1% |
| Nigerians | 3.5 /100 | #227 | Tragic 13.1% |
| Panamanians | 3.5 /100 | #228 | Tragic 13.1% |
| Ottawa | 3.5 /100 | #229 | Tragic 13.1% |
| Puget Sound Salish | 3.4 /100 | #230 | Tragic 13.1% |
| Immigrants | Nigeria | 3.4 /100 | #231 | Tragic 13.1% |