Marshallese vs Immigrants from Thailand Receiving Food Stamps
COMPARE
Marshallese
Immigrants from Thailand
Receiving Food Stamps
Receiving Food Stamps Comparison
Marshallese
Immigrants from Thailand
14.1%
RECEIVING FOOD STAMPS
0.3/ 100
METRIC RATING
254th/ 347
METRIC RANK
12.4%
RECEIVING FOOD STAMPS
17.0/ 100
METRIC RATING
206th/ 347
METRIC RANK
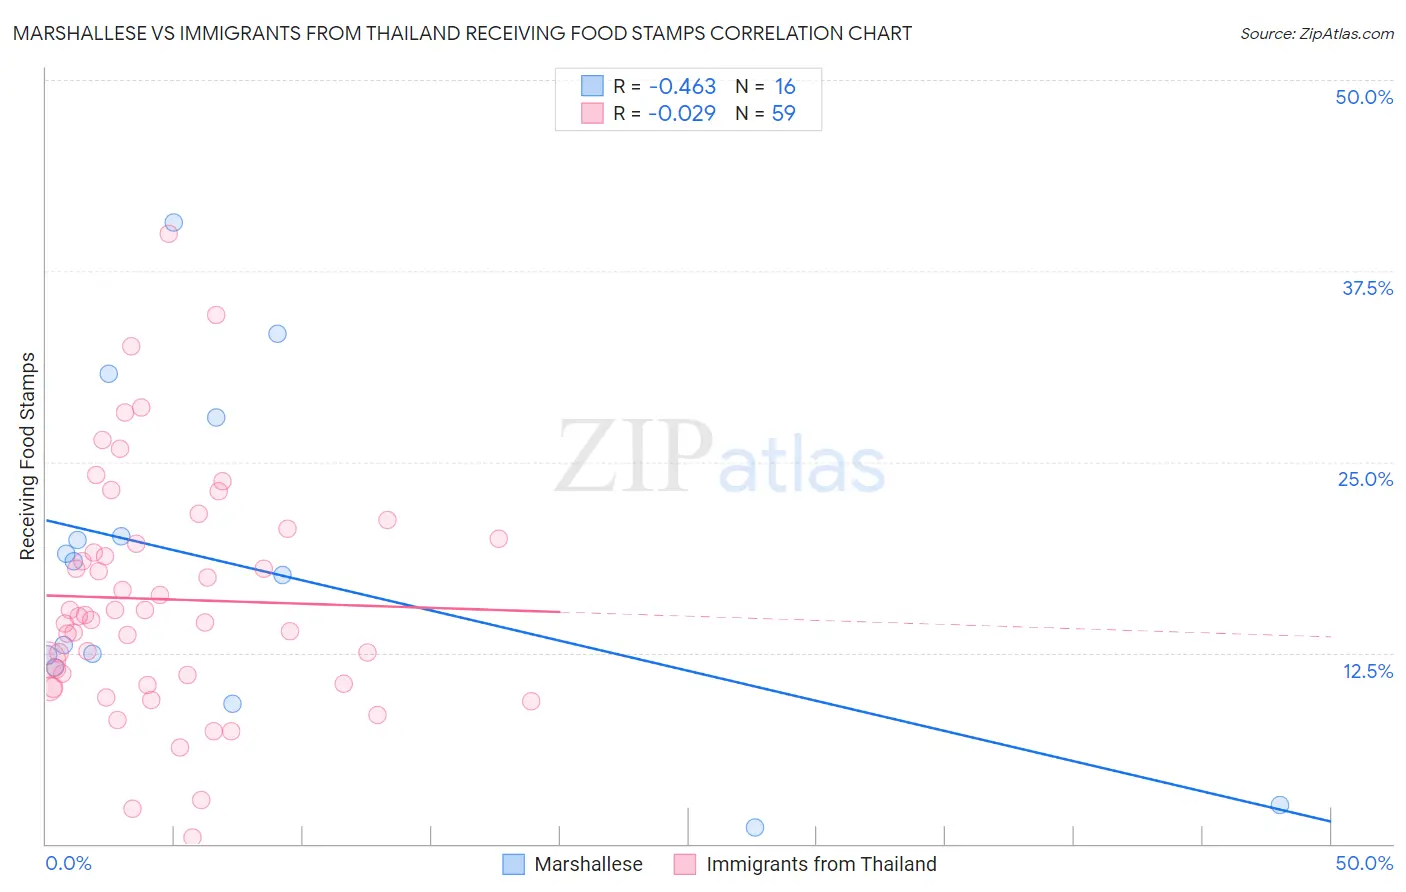
Marshallese vs Immigrants from Thailand Receiving Food Stamps Correlation Chart
The statistical analysis conducted on geographies consisting of 14,761,315 people shows a moderate negative correlation between the proportion of Marshallese and percentage of population receiving government assistance and/or food stamps in the United States with a correlation coefficient (R) of -0.463 and weighted average of 14.1%. Similarly, the statistical analysis conducted on geographies consisting of 316,534,905 people shows no correlation between the proportion of Immigrants from Thailand and percentage of population receiving government assistance and/or food stamps in the United States with a correlation coefficient (R) of -0.029 and weighted average of 12.4%, a difference of 13.7%.
Receiving Food Stamps Correlation Summary
| Measurement | Marshallese | Immigrants from Thailand |
| Minimum | 1.1% | 0.40% |
| Maximum | 40.7% | 39.9% |
| Range | 39.6% | 39.5% |
| Mean | 18.1% | 16.0% |
| Median | 18.0% | 14.9% |
| Interquartile 25% (IQ1) | 12.0% | 10.5% |
| Interquartile 75% (IQ3) | 24.0% | 20.0% |
| Interquartile Range (IQR) | 12.0% | 9.5% |
| Standard Deviation (Sample) | 10.8% | 7.7% |
| Standard Deviation (Population) | 10.5% | 7.7% |
Similar Demographics by Receiving Food Stamps
Demographics Similar to Marshallese by Receiving Food Stamps
In terms of receiving food stamps, the demographic groups most similar to Marshallese are Subsaharan African (14.1%, a difference of 0.010%), Japanese (14.1%, a difference of 0.030%), Arapaho (14.1%, a difference of 0.14%), Immigrants from Ghana (14.1%, a difference of 0.21%), and Creek (14.1%, a difference of 0.34%).
| Demographics | Rating | Rank | Receiving Food Stamps |
| Mexican American Indians | 0.7 /100 | #247 | Tragic 13.8% |
| Immigrants | Laos | 0.7 /100 | #248 | Tragic 13.8% |
| Indonesians | 0.6 /100 | #249 | Tragic 13.9% |
| Immigrants | Cambodia | 0.5 /100 | #250 | Tragic 13.9% |
| Yaqui | 0.5 /100 | #251 | Tragic 13.9% |
| Ghanaians | 0.5 /100 | #252 | Tragic 14.0% |
| Spanish Americans | 0.4 /100 | #253 | Tragic 14.0% |
| Marshallese | 0.3 /100 | #254 | Tragic 14.1% |
| Sub-Saharan Africans | 0.3 /100 | #255 | Tragic 14.1% |
| Japanese | 0.3 /100 | #256 | Tragic 14.1% |
| Arapaho | 0.3 /100 | #257 | Tragic 14.1% |
| Immigrants | Ghana | 0.3 /100 | #258 | Tragic 14.1% |
| Creek | 0.3 /100 | #259 | Tragic 14.1% |
| Central Americans | 0.3 /100 | #260 | Tragic 14.1% |
| Immigrants | Congo | 0.3 /100 | #261 | Tragic 14.1% |
Demographics Similar to Immigrants from Thailand by Receiving Food Stamps
In terms of receiving food stamps, the demographic groups most similar to Immigrants from Thailand are Aleut (12.4%, a difference of 0.060%), Nonimmigrants (12.4%, a difference of 0.13%), Shoshone (12.4%, a difference of 0.16%), South American (12.4%, a difference of 0.26%), and Potawatomi (12.5%, a difference of 0.62%).
| Demographics | Rating | Rank | Receiving Food Stamps |
| Portuguese | 25.1 /100 | #199 | Fair 12.2% |
| Sierra Leoneans | 23.6 /100 | #200 | Fair 12.2% |
| Ugandans | 22.5 /100 | #201 | Fair 12.2% |
| Immigrants | Venezuela | 20.1 /100 | #202 | Fair 12.3% |
| Shoshone | 17.7 /100 | #203 | Poor 12.4% |
| Immigrants | Nonimmigrants | 17.6 /100 | #204 | Poor 12.4% |
| Aleuts | 17.3 /100 | #205 | Poor 12.4% |
| Immigrants | Thailand | 17.0 /100 | #206 | Poor 12.4% |
| South Americans | 16.0 /100 | #207 | Poor 12.4% |
| Potawatomi | 14.6 /100 | #208 | Poor 12.5% |
| Immigrants | Sierra Leone | 12.9 /100 | #209 | Poor 12.5% |
| Immigrants | Uruguay | 12.8 /100 | #210 | Poor 12.5% |
| Colombians | 10.2 /100 | #211 | Poor 12.6% |
| Malaysians | 8.5 /100 | #212 | Tragic 12.7% |
| Moroccans | 7.6 /100 | #213 | Tragic 12.8% |